Data
- Procedures and Definitions
- Financial Years
- Adjusting Expenditures for Inflation
- Purchasing Power Parity Exchange Rates
- Cost Categories
- Funding Sources
- Full-Time Equivalents (FTEs)
Analysis
- ASTI intensity index
- R&D investment and knowledge stocks
- TFP projections
Practitioner's guide
Practitioner's guide for national and regional focal points (PDF)
Sample surveys
ASTI’s primary data surveys differ according to the type of agencies being surveyed. The following are downloadable examples of ASTI’s surveys in Excel format:
R&D Investment and Knowledge Stocks
The underlying assumption behind R&D investment and productivity is that a string of R&D investments creates a stock of knowledge that yields returns into the future. To construct such a stock, we need to determine how fast R&D investment enters and exits the stock of knowledge, and how the stock depreciates. We follow the work by Esposti and Pierani (2003) focused on agriculture and adopt the perpetual inventory method (PIM) to build the R&D knowledge stock in analogy with physical capital. The model requires little information: an initial value of the stock, the series of gross R&D investment, and three key parameters: a depreciation or decay rate of the stock (δ), a stochastic gestation lag period (G), and a parameter (β) that defines the shape of the gestation period. Using ASTI data on R&D investment and TFP changes estimated using FAO data we apply partial least squares (PLS), an approach that is particularly suited to the problem at hand, to recover the full set of basic parameters in the PIM and, with them, the lag structure linking R&D expenditure to the accumulation of the knowledge stock and its impact on productivity. The knowledge stocks and TFP projections are obtained following these steps:
1) ASTI uses PLS to determine the parameters that define the PIM model of knowledge stock:
Table—Estimated parameters of the PIM knowledge stock model for two groups of countries
Source: Elaborated by ASTI based on PLS regression.
2) With these parameters we calculate the knowledge stock for each country: Assuming, without loss of generality, that there is no contribution of R&D expenditure to knowledge stock during the gestation, the knowledge stock (KS) in period t can be represented as follows:
\( KS_{t}=KS_{t-1} (1-δ) + R_{t-G} \) (B.1)
where t is the current period, δ is the decay rate or “depreciation”, G the gestation period. In words, the knowledge stock in period t is equal to the knowledge stock in the previous period (t-1) less the depreciation of the stock (1- δ) and plus the R&D investment from period t-G (Rt-G), which means that there is a period (G) during which the investment matures until it can contribute new knowledge to the knowledge stock. If G=0, then investment in t incorporates immediately to the stock, no gestation period. The larger G, the longer it takes to investment to contribute to knowledge1. By backward substitution, equation (1) can be expressed as an infinite weighted sum of past investments:
\( KS_{t} = R_{t-G} + (1-δ)R_{t-(G+1)}+(1-δ)^{2}R_{t-(G+2)}+\cdots+(1-δ)^{s-G}R_{t-s}+\cdots \) (B.2)
where the weights are a function of the decay rate and of the age of the investment. Equivalently:
\( KS_{t}=ω_{0}R_{t}+ω_{1}R_{t-1}+ω_{2}R_{t-2}+\cdots+ω_{s}R_{t-s}+\cdots \) (B.3)
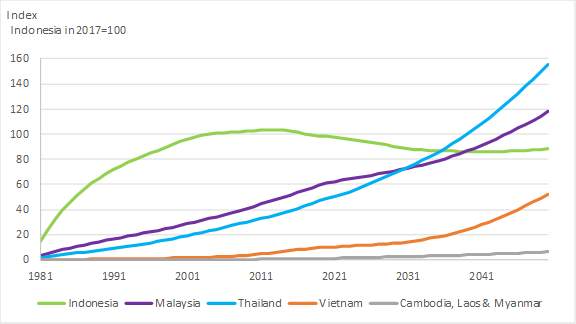
where ωs = (1-δ)s-G is a weight in the range of (0,1) and s is the investment’s age. In equations (B.2) and (B.3), the weight ωs=1 if s=G, ωs=0 if s<G, and 0<ωs<1 if s>G. The ωs in (3) can be interpreted as the contribution (productivity) of different “vintages” of R&D investment to the knowledge stock. They can also be viewed as the weights used to aggregate different vintages into one technology stock. On this basis, KSt is a measure of the aggregate knowledge stock at time t. The figure below shows the evolution of the knowledge stock of Southeast Asian countries between 1981 and 2017 and stocks projections to 2050 under the business-as-usual scenario.
Figure—Evolution of knowledge stocks between 1981 and 2017 and projections to 2050 under the business-as-usual scenario.
1. This is a simplification to illustrate the methodology. This is saying that we need to wait G years for this investment to be incorporated to the knowledge stock. Our model incorporates an increasing share of this investment during the gestation period, the share being determined by the parameter β.
ASTI tool: Maths equations libary (sites/all/libraries/asti-tools/maths)
Instance: No further settings