Infographic highlights:
|
In recent years ASTI has collected detailed data on agricultural R&D in South Asian and African countries. To fill geographical gaps in other regions, ASTI has worked closely with GFAR and a network of regional and national partners. The resulting data have been combined with OECD, Eurostat, and other secondary data to produce an accurate assessment of global public agricultural R&D spending in collaboration with colleagues at USDA-ERS. Global estimates need to be made with caution because spending patterns are often highly dynamic over time. As 2008 is the most recent year for which sufficiently reliable data are available, the assessment focuses on the 2000–2008 period. It has been published with GFAR as an input into GCARD 2012. |
| |
|
Background MaterialsUnderlying data tablesData sourcesMethodology |


In recent years ASTI has collected detailed data on agricultural R&D in South Asian and African countries. To fill geographical gaps in other regions, ASTI has worked closely with GFAR and a network of regional and national partners. The resulting data have been combined with OECD, Eurostat, and other secondary data to produce an accurate assessment of global public agricultural R&D spending in collaboration with colleagues at USDA-ERS. Global estimates need to be made with caution because spending patterns are often highly dynamic over time. As 2008 is the most recent year for which sufficiently reliable data are available, the assessment focuses on the 2000–2008 period. It has been published with GFAR as an input into GCARD 2012
- Download report (PDF 5.3Mb)
- Download infographic (PDF 2.1Mb)
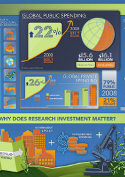
Infographic highlights:
- Developing countries drive public growth
- Global private spending
- R&D spending pays off
- The world’s poorest countries lag behind
- Why do research investments matter?
Background Materials
ASTI tool: Global Assessment CSS
Instance: No further settings