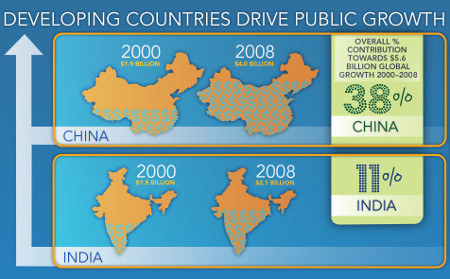
Following a decade of slowing growth in the 1990s, global public spending on agricultural R&D increased from 26.1 in 2000 to 31.7 billion in inflation-adjusted PPP dollars — an increase of 22 percent. Spending was roughly evenly split between high-income countries and low- and middle-income countries, with China, India, and Brazil accounting for a quarter of global spending and half of combined developing-country spending. Excluding these three countries, spending by developing-country region (Africa south of the Sahara, Asia - Pacific, Latin American and Caribbean, West Asia and North Africa, and eastern Europe and the former Soviet States) amounted to only 3 to 6 percent of global public spending.
 Other more advanced middle-income countries also increased their public agricultural R&D spending during 2000–2008 (particularly Argentina, Brazil, Iran, Nigeria, and Russia). Growth in low-income countries was driven by Ethiopia, Kenya, Tanzania, and Uganda. Notably, increased spending in a number of countries, especially in Africa south of the Sahara, was directed to much-needed salary increases and infrastructure rehabilitation and, hence, did not result in the conduct of higher levels of research.
In contrast, spending by high-income countries actually continued to slow. About one-third of the OECD countries spent less on public agricultural R&D in 2008 than they did in 2000. Japan and the United States remained the top spenders among high-income countries, accounting for half that income group's total spending on agricultural R&D and most of its 2000 - 2008 growth.
Back to ASTI Global Assessment
ASTI tool: Global Assessment CSS
Instance: No further settings