The ASTI Data in Focus series provides additional background data in support of the 2010 Country Note on Zambia (asti.cgiar.org/pdf/Zambia-Note.pdf) prepared by the Agricultural Science and Technology Indicators (ASTI) initiative. Based on data collected by ASTI, these two outputs review major investment and capacity trends in Zambian public agricultural research and development (R&D) since 1971, providing important updates on agricultural R&D trends prepared by ASTI in 2000–03.
B. Financial Resources
This section provides detailed quantitative information on agricultural research expenditures and sources of funding in the government sector in Zambia for the period 1991–2008. Complementary sections present detailed data on long-term trends (Section A), human resources (Section C), and research allocation (Section D). Other supporting information provides macroeconomic trends, a list of agencies included in the study, data sources and estimation procedures, and ASTI’s methodology.
Table B1—Total spending levels in billion 2005 Zambian kwacha, various agencies, 2008
Zambia’s main agricultural research agency, the Zambia Agriculture Research Institute (ZARI), recorded the largest expenditures, at 8.7 billion 2005 kwacha or 43 percent. The Golden Valley Agricultural Research Trust (GART) ranked second, reporting expenditures of 4.1 billion 2005 kwacha or 20 percent. The three units that conduct agricultural R&D under the National Institute for Scientific and Industrial Research (NISIR) spent a combined 2.6 billion kwacha, but their individual shares were relatively small.
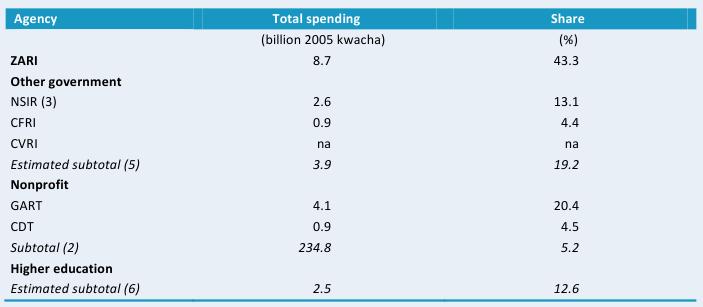
Source: Calculated by authors from ASTI 2009.
Notes: Figures in parentheses indicate the number of agencies in each category. Expenditures for the six higher education agencies were estimated. For more information on coverage and estimation procedures, see the Zambia country page on ASTI’s website at asti.cgiar.org/zambia/datacoverage; for full agency names, see asti.cgiar.org/zambia/agencies.
Figure B1—ZARI’s spending by cost category adjusted for inflation, 2001–08
In 2008, expenditures at ZARI were evenly split between salaries and nonsalary expenses. The 4 billion kwacha the agency spent on operating and capital costs that year represent a significant increase over the 2006 levels of only 1 billion kwacha, both in absolute and relative terms.
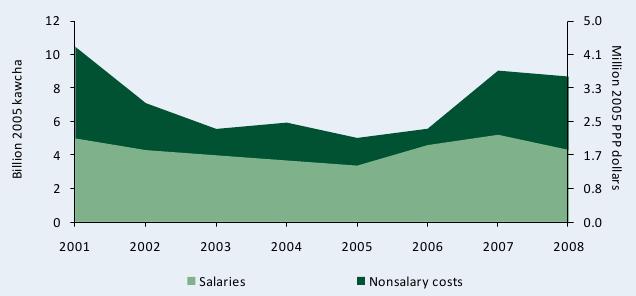
Source: Calculated by authors from ASTI 2009.
Note: Donor funding allocated collectively to operating and capital expenses could not be disaggregated; as a result, only salary and nonsalary costs could be identified.
Figure B2—Distribution of agencies’ spending by cost-category, 2008
In 2008, salaries represented 40 percent or more of ZARI’s total spending and at least 60 percent of spending at the other government agencies. Shares allocated to operating costs and capital investments varied widely across agencies. In 2008, the Sustainable Use of Underutilized Genetic Resources unit of NISIR (SUUGR-NISIR) invested over 30 percent of its budget on capital improvements, whereas the Post Harvest Food Processing and Nutrition unit of NISIR (PHFPN-NISIR) made no capital investments.
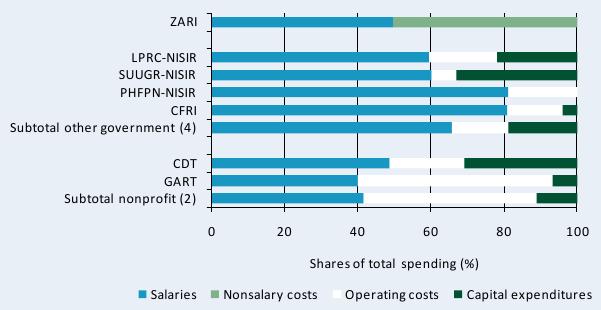
Source: Calculated by authors from ASTI 2009.
Notes: For more information on coverage and estimation procedures, see the Zambia country page on ASTI’s website at asti.cgiar.org/zambia/datacoverage; for a complete list of the agencies included in the sample, see asti.cgiar.org/zambia/agencies.
Figure B3—ZARI’s funding sources adjusted for inflation, 1995–2008
During 1995–2008, funding from donors and development banks fell dramatically. In 2008, ZARI received 0.3 billion kwacha or 0.1 million PPP dollars from donors, compared with 42.7 billion kwacha or 17.7 million PPP dollars in 1996 (all in 2005 constant prices).
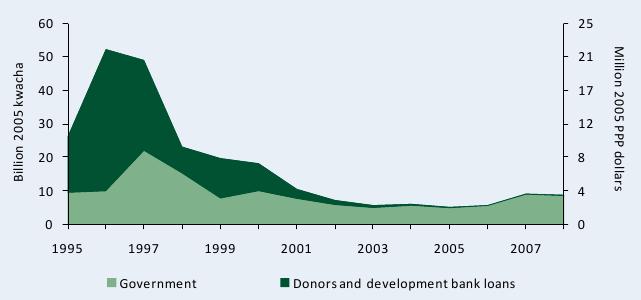
Source: Calculated by authors from ASTI 2009 and Beintema et al. 2004.