The ASTI Data in Focus series provides additional background data in support of the 2010 Country Note on Zambia (asti.cgiar.org/pdf/Zambia-Note.pdf) prepared by the Agricultural Science and Technology Indicators (ASTI) initiative. Based on data collected by ASTI, these two outputs review major investment and capacity trends in Zambian public agricultural research and development (R&D) since 1971, providing important updates on agricultural R&D trends prepared by ASTI in 2000–03.
A. Long-Term Trends
This section provides detailed quantitative information on long-term investment and capacity trends in Zambian public agricultural R&D for the period 1971–2008. Subsequent sections present detailed data on financial resources (Section B), human resources (Section C), and research allocation (Section D). Other supporting information provides macroeconomic trends, a list of agencies included in the study, data sources and estimation procedures, and ASTI’s methodology.
Figure A1—Public agricultural R&D spending adjusted for inflation, 1971–2008
During the 1990s, public spending on agricultural research and development (R&D) in Zambia fell drastically from the levels recorded in the 1970s and 1980s. Spending at the Zambia Agriculture Research Institute (ZARI) decreased the most, from a peak of 65.7 billion kwacha or 27.2 million PPP dollars in 1991 at ZARI’s predecessor, the Soil and Crops Research Branch (SCRB), to 8.7 billion kwacha or 3.6 million PPP dollars in 2008 (all in constant 2005 prices).
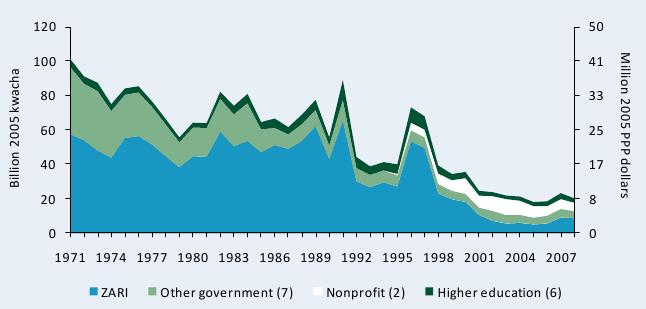
Source: Calculated by authors from ASTI 2009 and Beintema et al. 2004.
Notes: Figures in parentheses indicate the number of agencies in each category. The total sample includes two government agencies that discontinued research activities before 2008. For more information on coverage and estimation procedures, see the Zambia country page on ASTI’s website at asti.cgiar.org/zambia/datacoverage.
Figure A2—Public agricultural R&D spending in current kwacha, 1991–2008
Public agricultural R&D spending increased during 1991–2008 in current prices, but levels have not kept pace with national inflation rates (see Figure A1). In 2008, Zambia spent 28.1 billion current kwacha, compared with 20.0 billion kwacha in inflation-adjusted (2005) prices.
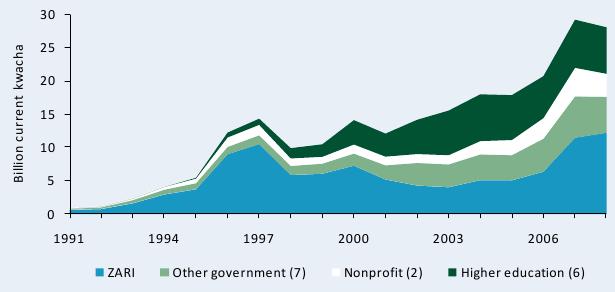
Source: Calculated by authors from ASTI 2009 and Beintema et al. 2004.
Notes: Figures in parentheses indicate the number of agencies in each category. Because of high inflation rates, spending levels for the 1970s and 1980s could not be presented graphically.
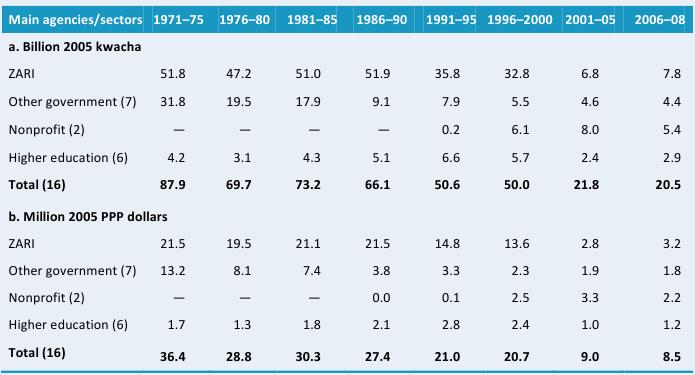
Table A1—Public agricultural research spending, 1971–2008
The underlying data show that total spending on public agricultural R&D in Zambia averaged 20.5 billion kwacha or 8.5 million PPP dollars per year during 2006–08 (both in constant 2005 prices), which is well below the levels recorded in the preceding decades. By way of comparison, Zambia spent an average of 87.9 billion kwacha or 36.4 million PPP dollars per year on public agricultural R&D in the early 1970s.
Source: Calculated by authors from ASTI 2009 and Beintema et al. 2004.
Notes: Figures in parentheses indicate the number of agencies in each category. Calculations are based on five-year averages with the exception of 2006–08, a three-year average. Expenditures for the six higher education agencies were estimated. For more information, see asti.cgiar.org/
zambia/datacoverage.
Figure A3—Shares of agricultural R&D spending by institutional category, 1971–2008
Until the turn of the millennium, ZARI accounted for more than half of total agricultural R&D spending, but its share dropped to an average of 31 percent during 2001–05 and thereafter rebounded to an average of 38 percent during 2006–08. During this period, the two nonprofit agencies—the Golden Valley Agricultural Research Trust (GART) and the Cotton Development Trust (CDT)—accounted for 27 percent of total spending; the other government agencies accounted for a combined 21 percent, and the higher education sector accounted for 14 percent.
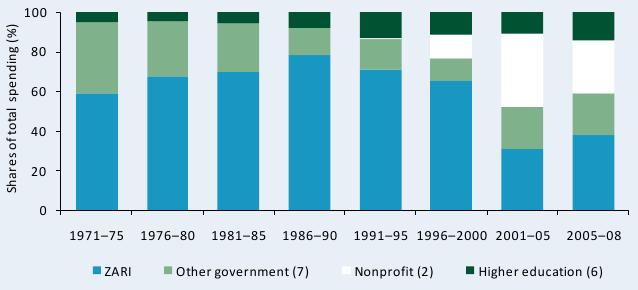
Source: Calculated by authors from ASTI 2009 and Beintema et al. 2004.
Notes: Calculations are based on five-year averages with the exception of 2006–08, a three-year average. Figures in parentheses indicate the number of agencies in each category.
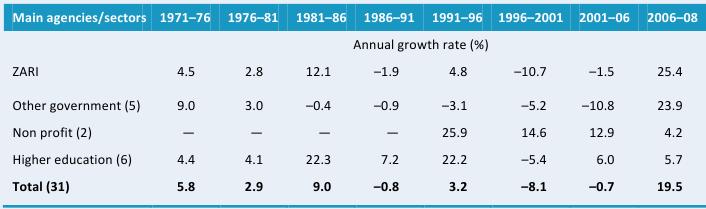
Table A2—Annual rates of R&D spending growth by institutional category, 1971–2008
Unsurprisingly, the annual rate of growth in public agricultural R&D spending in Zambia was negative throughout the 1971–2008 period, the only exceptions being the late-1980s and 2006–08. Negative growth was particularly severe during 1996–2001, when the rate averaged –19.4 percent per year. Notably, the two nonprofit agencies experienced positive growth due to high expenditures associated with their establishment. The positive average growth recorded during 2006–08 was due to a large increase in spending at ZARI; annual growth rates for all other agency groups remained negative during this time.
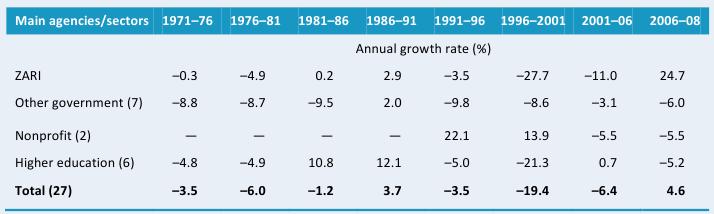
Source: Calculated by authors from ASTI 2009 and Beintema et al. 2004.
Notes: Figures in parentheses indicate the number of agencies in each category. Annual growth rates were calculated using the least squares regression method. Expenditures for the six higher education agencies were estimated. For more information, see asti.cgiar.org/zambia/datacoverage.
Figure A4—Public agricultural research staffing in full-time equivalents, 1971–2008
Unlike agricultural R&D expenditures, public agricultural research staffing increased during 1971–2008, peaking at 229 full-time equivalent (FTE) researchers in 1997. Levels rapidly declined during 2002–07 due to a hiring freeze, but once this was lifted levels rebounded, reaching 209 FTEs in 2008.
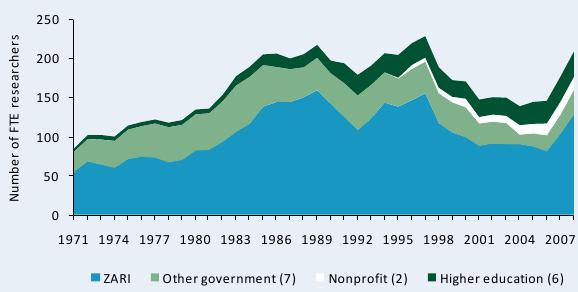
Source: Calculated by authors from ASTI 2009, Copperbelt University 2010, and Beintema et al. 2004.
Notes: Figures in parentheses indicate the number of agencies in each category. The sample includes two government agencies that discontinued research activities before 2008. Data include expatriate research staff employed at ZARI/SCRB in the 1980s and early 1990s.
Table A3—Public agricultural research staffing in full-time equivalents, 1971–2008
Disaggregated data illustrate the instability of research staffing levels at Zambia’s agricultural research agencies over time. The average number of researchers steadily rose from 101 FTEs in the early 1970s to 205 during 1986–90; thereafter numbers fell to an average of 147 FTEs in the late-1990s, before climbing to 177 during 2006–08.
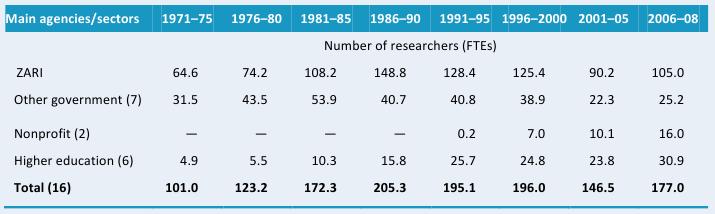
Source: Calculated by authors from ASTI 2009, Copperbelt University 2010, and Beintema et al. 2004.
Notes: Figures in parentheses indicate the number of agencies in each category. The sample includes two government agencies that discontinued research activities before 2008. Data include expatriate research staff employed at ZARI/SCRB in the 1980s and early 1990s.
Figure A5—Shares of agricultural R&D staffing levels by institutional category, 1971–2008
The government sector’s dominance contracted somewhat during the early 1990s, initially due to growth of the higher education sector, and from the late-1990s due to the establishment of the two nonprofit agencies. The higher education sector’s share grew from 5 percent during 1971–75 to 17 percent during 2005–2008, whereas the nonprofits sector’s share grew from 4 percent during the late-1990s to 9 percent during 2005–08.
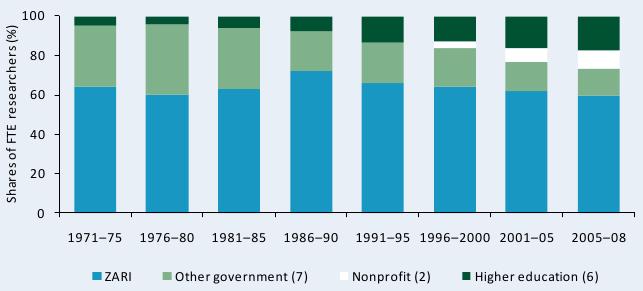
Source: Calculated by authors from ASTI 2009, Copperbelt University 2010, and Beintema et al. 2004.
Note: Figures in parentheses indicate the number of agencies in each category.
Table A4—Annual rates of growth in R&D staffing by institutional category, 1971–2008
Average annual rates of growth in agricultural R&D staffing fluctuated during 1971–2008. Negative growth in the government sector during the late-1990s and early 2000s, together with the strong positive growth thereafter, reflects the aforementioned hiring freeze and its aftermath. Agency-level growth varied significantly within the government sector, however; research staffing levels at the Central Fisheries Research Institute (CFRI), for example, grew at a rate of nearly 10 percent annually during 2006–08, whereas they declined at –10 percent per year at the Livestock and Pest Research Centre of the National Institute for Scientific and Industrial Research (LPRC-NISIR). Levels followed a similar but less extreme pattern in the higher education sector.
Source: Calculated by authors from ASTI 2009, Copperbelt University 2010, and Beintema et al. 2004.
Notes: Figures in parentheses indicate the number of agencies in each category. Annual growth rates were calculated using the least squares regression method.
Table A5—Various agricultural research intensity ratios, 1971–2008
Unsurprisingly, all agricultural research intensity ratios decreased dramatically during 1971–2008. In particular, annual spending on research as a share of agricultural output (AgGDP) plummeted from $3.56 in the early 1970s to $0.29 during 2005–08. Similarly, the average number of FTE researchers per million population peaked at an average of 27.6 in the late-1980s and then fell to 14.3 during 2005–08.
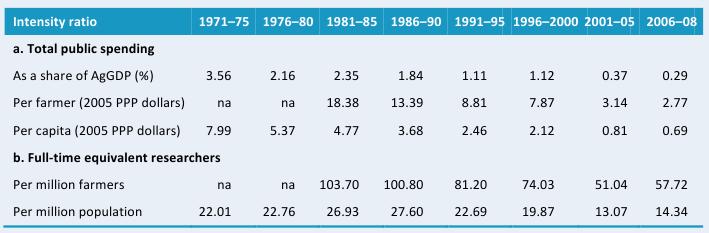
Source: Calculated by authors from ASTI 2009, Beintema et al. 2004, FAO 2009, and World Bank 2009.
Notes: Calculations are based on five-year averages with the exception of 2005–08, a three-year average. Research spending as a share of AgGDP is calculated using a weighted average. Farmers are defined as the economically active agricultural population (an FAO classification). Pre-1980 data on farmer numbers were unavailable.