The ASTI Data in Focus series provides additional background data in support of the 2010 Country Note on Tanzania (asti.cgiar.org/pdf/Tanzania-Note.pdf) prepared by the Agricultural Science and Technology Indicators (ASTI) initiative and the Department of Research and Development (DRD). Based on data collected by ASTI and DRD, these two outputs review major investment and capacity trends in Tanzanian public agricultural research and development (R&D) since 1991, providing important updates on agricultural R&D trends prepared by ASTI and DRD in 2000 - 03.
C. Human Resources
This section provides detailed quantitative information on full-time equivalent (FTE) agricultural research and support staff trends including qualifications, gender and age distribution, and support-staff-per-researcher ratios. Supplementary sections present detailed data on long-term trends (Section A), financial resources (Section B) and research allocation (Section D). Other supporting information provides macroeconomic trends, a list of agencies included in the study, data sources and estimation procedures, and ASTI's methodology.
Table C1–Total researcher levels across various agencies, 2008
In 2008, the Department of Research and Development (DRD) under the Ministry of Agriculture, Food Security, and Cooperatives (MAFC) accounted for 44 percent of Tanzania's total agricultural R&D capacity (294 full-time equivalent [FTE] researchers). The Department of Research, Training, and Extension (DRTE) under the Ministry of Livestock Development, and Fisheries (MLDF) was the second-largest agency, with 96 FTE researchers. The other government agencies together employed 138 FTE researchers or 20 percent of the country's agricultural R&D capacity. Sokoine University of Agriculture (SUA), the country's leading university in terms of researchers, employed 99 agricultural FTEs in 2008. Combined, the nonprofit coffee, tobacco, and tea research institutes employed 24 FTE researchers, accounting for 4 percent of overall capacity in 2008.
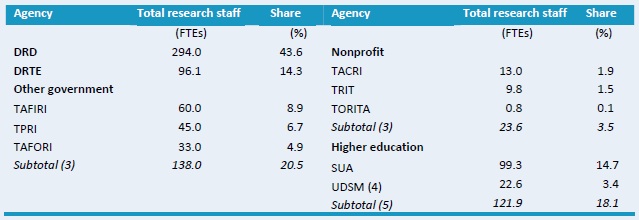
Source: Calculated by authors from ASTI - DRD 2009 - 10 and UDSM various years.
Notes: Figures in parentheses indicate the number of agencies in each category. For more information on coverage and estimation procedures, see the Tanzania country page on ASTI's website at asti.cgiar.org/tanzania/datacoverage.; for a complete list of the agencies included in the sample, see asti.cgiar.org/tanzania/agencies.
Figure C1–Research staffing trends at DRD and DRTE by degree level (in full-time equivalents), 1991 - 2008
DRD's research capacity decreased slightly from the early 1990s to 2000. DRTE was established in 2001 when all livestock capacity was transferred from DRD, although DRTE did not become operationally independent of DRD until 2006. Researcher numbers began to increase in 2001 after the end of a hiring freeze, but levels once again fell in 2007 due to the retirement of a number of staff. Overall, DRD and DRTE staff became more qualified over time. In 1991, only 53 percent of researchers held postgraduate degrees compared with 69 percent in 2008.
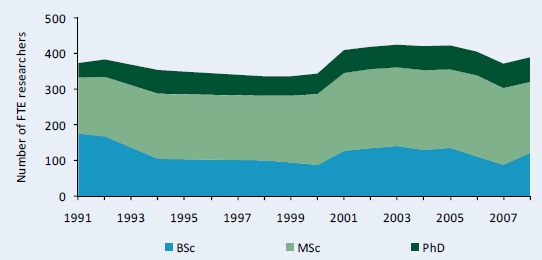
Source: Calculated by authors from ASTI - DRD 2009 - 10 and Beintema, Ngahulira, and Kirway 2003.
Note: Researchers excludes expatriate staff working at DRD. For more information on coverage and estimation procedures, see the Tanzania country page on ASTI's website at asti.cgiar.org/tanzania/datacoverage.
Figure C2–Full-time equivalent researcher trends at other government agencies by degree, 1991 - 2008
From 1991 to 2008, the number of researchers at the other government agencies increased from 81 to 138 FTEs. Researchers at other government agencies also became better qualified during this time. The number of researchers holding PhD degrees increased from 8 to 16 FTEs, while the number of researchers holding MSc degrees increased from 31 to 66 FTEs.
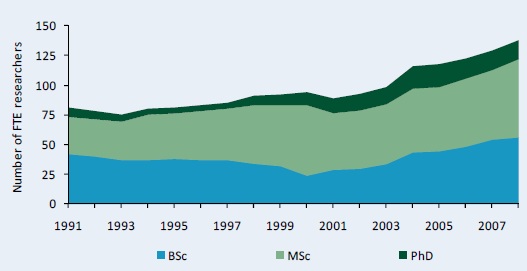
Source: Calculated by authors from ASTI - DRD 2009 - 10 and Beintema, Ngahulira, and Kirway 2003.
Note: Researchers exclude expatriate staff working at TAFORI during 1997 - 98.
Figure C3–Full-time equivalent researcher trends at nonprofit agencies by degree, 1998 - 2008
As a combined average, capacity at the research institutes for coffee (TACRI), tea (TRIT), and tobacco (TORITA) grew between 1998 and 2006, contracted somewhat in 2007, then rebounded slightly to 24 FTE researchers in 2008. Qualification levels varied considerably, however. While TACRI was the largest research institute with 13 FTE researchers, it only employed one researcher with a PhD degree in 2008.
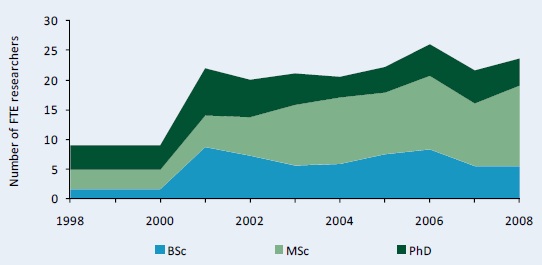
Source: Calculated by authors from ASTI - DRD 2009 - 10 and Beintema, Ngahulira, and Kirway 2003.
Figure C4–Full-time equivalent researcher trends at higher education agencies by degree, 1991 - 2008
During 1991 - 2008, the number of researchers employed at the higher education agencies increased significantly, from 69 to 122 FTEs. The largest increase occurred between 2002 and 2008, when researcher numbers grew from 84 to 122 FTEs. Researchers in the higher education sector also became more highly qualified given that the number of PhD-qualified researchers more than doubled between 1991 and 2008.
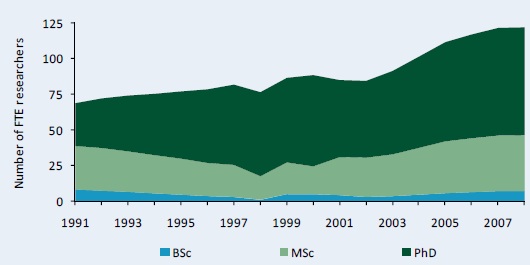
Source: Calculated by authors from ASTI - DRD 2009 - 10; Beintema, Ngahulira, and Kirway 2003; and UDSM various years.
Note: Researchers exclude expatriate staff working at the higher education agencies.
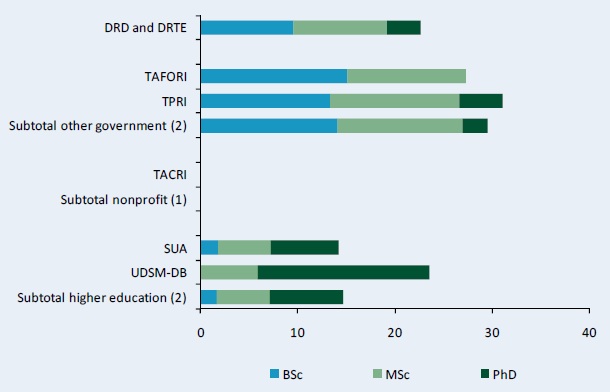
Figure C5–Distribution of researcher qualifications across various agencies, 2008
At DRD and DRTE, 18 percent of researchers were PhD qualified and 56 percent held MSc degrees. Other government agencies recorded similar shares. TACRI and TRIT had even numbers of degree-qualified researchers, whereas the majority of researchers at TACRI were MSc qualified. Consistent with findings worldwide, the higher education agencies employed more PhD-qualified researchers on average (over 50 percent) compared with the government and nonprofit agencies.
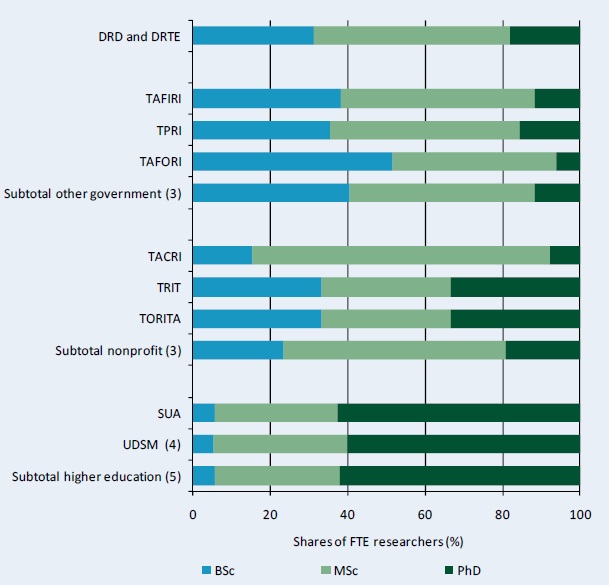
Source: Calculated by authors from ASTI - DRD 2009 - 10 and UDSM various years.
Figure C6–Share of female researchers by degree and institutional category, 2000 and 2008
The share of female agricultural researchers remained constant, at around 21 percent, between 2000 and 2008. However, the share of female researchers varied significantly across agencies. A quarter of DRD and DRTE staff were female in 2000, with the share slightly dropping in 2008 as the number of male researchers hired over that period outpaced the number of females. TAFORI and TPRI had a higher share of female staff in 2008 at 30 percent, while in the higher education sector the female share only reached 15 percent.
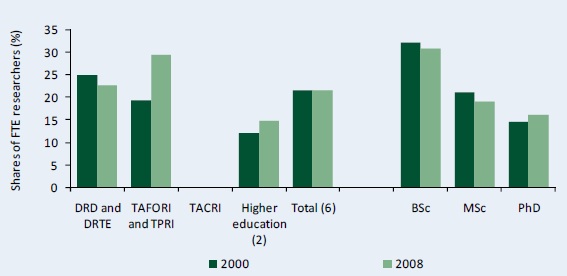
Source: Calculated by authors from ASTI - DRD 2009 - 10 and Beintema, Ngahulira, and Kirway 2003.
Note: Figures in parentheses indicate the number of agencies in each category. 2000 gender data were only available for DRD, TAFORI, TPRI, TACRI, SUA, and DB-UDSM. For a complete list of agency names, see asti.cgiar.org/tanzania/datacoverage.
Figure C7– Distribution of researcher qualifications by gender, 2000 and 2008
The share of PhD-qualified male researchers decreased from 30 to 26 percent during 2000 - 08, whereas the share of PhD-qualified female researchers largely remained constant over this timeframe, at around 18 percent. However, both male and female researcher numbers increased across all degree levels during 2000?08. Increases were greatest at the BSc degree level however.
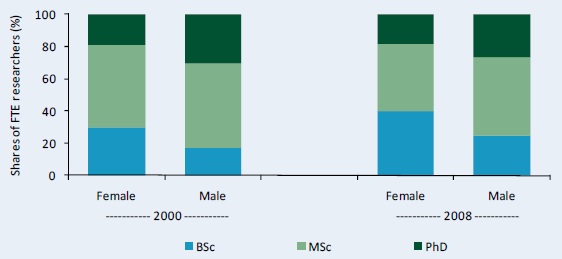
Source: Calculated by authors from ASTI - DRD 2009 - 10 and Beintema, Ngahulira, and Kirway 2003.
Note: See Figure C6 for agency sample size.
Figure C8–Share of female FTE researchers by degree across various agencies, 2008
In 2008, the Tropical Pesticides Research Institute (TPRI) employed the highest share of female researchers, at 31 percent, but none of these researchers held PhD degrees. At DRD and DRTE, 23 percent of the researchers were female, and of these, 15 percent held PhD degrees, 42 percent held MSc degrees, and 42 percent held BSc degrees. In contrast, only 15 percent of researchers at the other universities (as a combined average) were female, but half of them were PhD qualified.
Source: Calculated by authors from ASTI - DRD 2009 - 10.
Note: See Figure C6 for agency sample size.
Figure C9–Trends in full-time equivalent support staff at DRD and DRTE, 2001 - 08
The overall number of support staff at DRD and DRTE–including technicians, administrative staff, and other support staff–increased from 839 to 1,027 FTEs during 2001?08. Most technicians were not degree qualified, but some held diplomas.
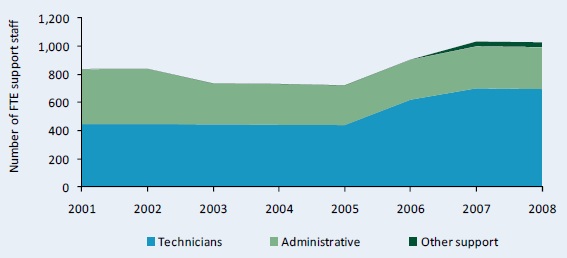
Source: Calculated by authors from ASTI - DRD 2009 - 10.
Figure C10–Support-staff-per-researcher ratios by institutional category, 2001 and 2008
Numbers of both FTE researchers and support staff increased between 2001 and 2008. Numbers of support staff increased slightly more, however, resulting in higher overall support-staff-per-researcher ratios (2.7 in 2008 compared with 2.3 in 2001). The government and nonprofit sectors reported much higher ratios compared with the higher education sector, but this is common given that research is a secondary mandate at the higher education agencies.
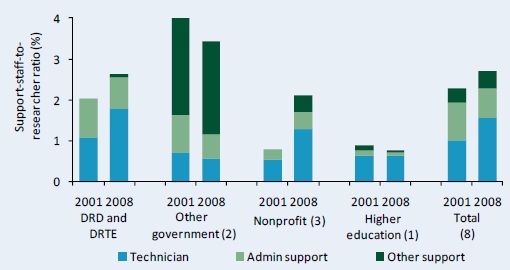
Source: Calculated by authors from ASTI - DRD 2009 - 10.
Notes: Figures in parentheses indicate the number of agencies in each category. For more information on coverage and estimation procedures, see the Tanzania country page on ASTI's website at asti.cgiar.org/tanzania/datacoverage.
Copyright (C) 2011 International Food Policy Research Institute and Department of Research and Development. Sections of this Data in Focus issue may be reproduced without the express permission of, but with acknowledgement to, IFPRI and DRD. This series has been prepared as an output for the ASTI initiative and has not been peer reviewed. Any opinions stated herein are those of ASTI and do not necessarily reflect the policies and opinions of IFPRI or DRD.