The ASTI Data in Focus series provides additional background data in support of the 2010 Country Note on Tanzania (asti.cgiar.org/pdf/Tanzania-Note.pdf asti.cgiar.org/pdf/Kenya-Note.pdf]) prepared by the Agricultural Science and Technology Indicators (ASTI) initiative and the Department of Research and Development (DRD). Based on data collected by ASTI and DRD, these two outputs review major investment and capacity trends in Tanzanian public agricultural research and development (R&D) since 1991, providing important updates on agricultural R&D trends prepared by ASTI and DRD in 2000 - 03.
B. Financial Resources
This section provides detailed quantitative information on agricultural research expenditures and sources of funding in the government sector in Tanzania for the period 1991 - 2008. Supplementary sections present detailed data on long-term trends (Section A), human resources (Section C), and research allocation (Section D). Other supporting information provides macroeconomic trends, a list of agencies included in the study, data sources and estimation procedures, and ASTI's methodology.
Table B1–Total spending levels at various agencies, 2008
In 2008, the Department of Research and Development (DRD) under the Ministry of Agriculture, Food Security, and Cooperatives (MAFC) accounted for the largest share of total expenditures, at 12.2 billion 2005 shillings. The Department of Research, Training, and Extension (DRTE) under the Ministry of Livestock Development and Fisheries (MLDF) ranked second, reporting expenditures of 4.5 billion shillings, followed by the Tanzania Fisheries Research Institute (TAFIRI), with expenditures of 2.5 billion 2005 shillings.
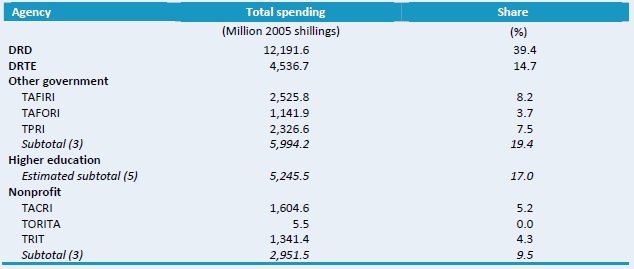
Source: Calculated by authors from ASTI - DRD 2009 - 10.
Notes: Figures in parentheses indicate the number of agencies in each category. Expenditures for the five higher education agencies were estimated. For more information on coverage and estimation procedures, see the Tanzania country page on ASTI's website at asti.cgiar.org/sudan/datacoverage. For full agency names see asti.cgiar.org/sudan/agencies.
Figure B1–DRD and DRTE's spending by cost category, adjusted for inflation, 1996 - 2008
In 1998, the cost of salaries at DRD quadrupled due to payouts to retrenched staff. During 2005 - 06, the cost of salaries doubled at DRD and DRTE, although the share of salaries fell because operating and capital expenditures also increased. In 2008, salaries accounted for 29 percent of total spending, while operating costs amounted to 39 percent and capital costs to 32 percent. Operating and capital expenses fluctuated considerably throughout the 1996 - 2008 period because of variations in donor funding.
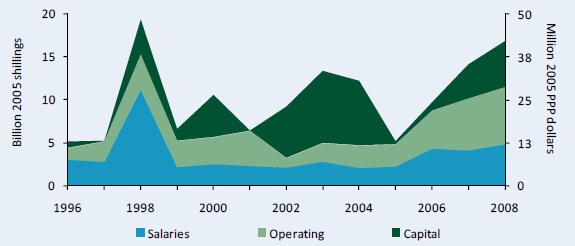
Source: Calculated by authors from ASTI - DRD 2009 - 10 and Beintema, Ngahulira, and Kirway 2003.
Notes: Salaries exclude those of expatriate staff. For more information on coverage and estimation procedures, see the Tanzania country page on ASTI's website at asti.cgiar.org/tanzania/datacoverage..
Figure B2–Distribution of spending by cost category at government and nonprofit agencies, 2008
Whereas DRD and DRTE's share of salary, operating, and capital expenses was relatively even, salaries represented a much higher share at the other government agencies (combined). In contrast, nonprofit agencies recorded much higher average operating costs, ranging from 65 to 90 percent of their total costs.
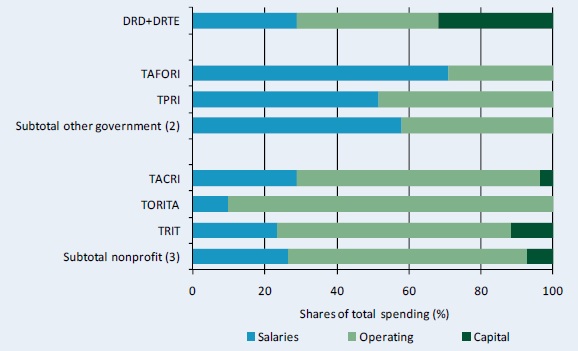
Source: Calculated by authors from ASTI - DRD 2009 - 10.
Figure B3–DRD's funding sources, adjusted for inflation, 1996 - 2008
Traditionally, Tanzania has been highly dependent on donor contributions in addition to government funding for agricultural research. However, donor funding became highly variable after 1996, ranging from more than half of DRD's total funding in 2000, to none in 2005. When donor funding plummeted in 2004/05, the national government increased its contributions in efforts to fill the gap. The sale of goods and services supplements DRD's funding, contributing 4 percent in 2008.
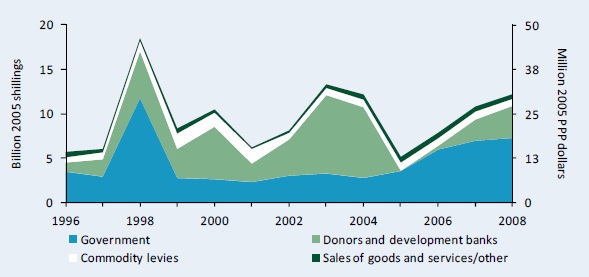
Source: Calculated by authors from ASTI - DRD 2009 - 10 and Beintema, Ngahulira, and Kirway 2003.
Note: Donor funding does not include the salaries of expatriate staff working at DRD.
Copyright (C) 2011 International Food Policy Research Institute and Department of Research and Development. Sections of this Data in Focus issue may be reproduced without the express permission of, but with acknowledgement to, IFPRI and DRD. This series has been prepared as an output for the ASTI initiative and has not been peer reviewed. Any opinions stated herein are those of ASTI and do not necessarily reflect the policies and opinions of IFPRI or DRD.