The ASTI Data in Focus series provides additional background data in support of the 2010 Country Note on Tanzania (asti.cgiar.org/pdf/Tanzania-Note.pdf) prepared by the Agricultural Science and Technology Indicators (ASTI) initiative and the Department of Research and Development (DRD). Based on data collected by ASTI and DRD, these two outputs review major investment and capacity trends in Tanzanian public agricultural research and development (R&D) since 1991, providing important updates on agricultural R&D trends prepared by ASTI and DRD in 2000 - 03.
Long-Term Trends
This section provides detailed quantitative information on long-term investment and capacity trends in Tanzanian public agricultural R&D for the period 1991 - 2008. Subsequent sections present detailed data on financial resources (Section B), human resources (Section C), and research allocation (Section D). Other supporting information provides macroeconomic trends, a list of agencies included in the study, data sources and estimation procedures, and ASTI's methodology.
Figure A1–Public agricultural R&D spending adjusted for inflation, 1996 - 2008
From 1996 to 2008, public spending on agricultural research and development (R&D) in Tanzania ranged from 9 to 31 billion shillings (22 to 78 million PPP dollars in constant 2005 prices) due to variations in donor funding. In 2005, agricultural R&D spending fell dramatically as a result of decreasing donor support. By 2008, however, investment in public agricultural R&D had rebounded to 31 billion shillings or 78 million PPP dollars.
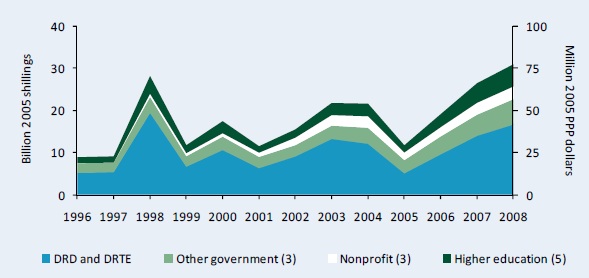
Source: Calculated by authors from ASTI - DRD 2009 - 10 and Beintema, Ngahulira, and Kirway 2003.
Notes: Figures in parentheses indicate the number of agencies in each category. For more information on coverage and estimation procedures, see the Tanzania country page on ASTI's website at asti.cgiar.org/tanzania.
Figure A2–Public agricultural R&D spending in current shillings, 1996 - 2008
Public agricultural R&D spending increased more rapidly in current prices. In 2008, agricultural R&D expenditures reached 39 billion shillings, 8 billion shillings more in current prices than when adjusted for inflation.
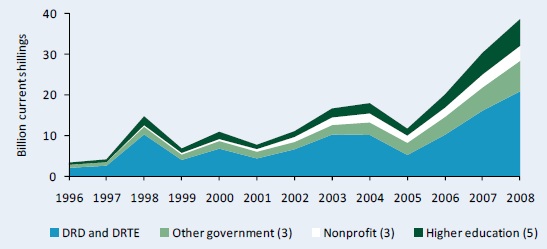
Source: Calculated by authors from ASTI - DRD 2009 - 10 and Beintema, Ngahulira, and Kirway 2003.
Note: Figures in parentheses indicate the number of agencies in each category.
Table A1–Public agricultural research spending, 1996 - 2008
Increases in public R&D spending between 1996 and 2008 occurred across each agency grouping. During 2006 - 08, average total spending reached 25.5 billion shillings or 64.4 million PPP dollars compared with 15.0 billion shillings or 38.0 million PPP dollars during the late-1990s (all in constant 2005 prices).
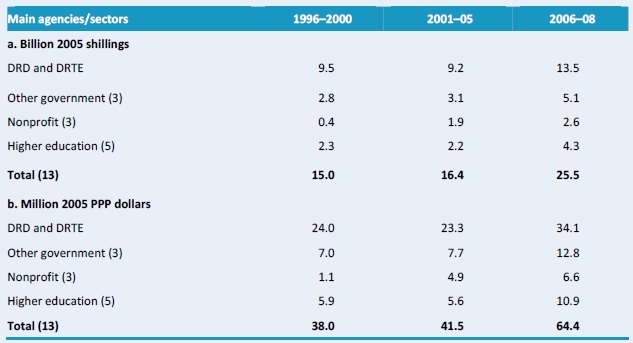
Source: Calculated by authors from ASTI - DRD 2009 - 10 and Beintema, Ngahulira, and Kirway 2003.
Notes: Figures in parentheses indicate the number of agencies in each category. Calculations are based on five-year averages–with the exception of 2006 - 08, a three-year average. Expenditures for the six higher education agencies were estimated. For more information, see asti.cgiar.org/tanzania/datacoverage.
Figure A3–Shares of agricultural R&D spending by institutional category, 1996 - 2008
During the late-1990s, two main government agencies–the Department of Research and Development (DRD) of the Ministry of Agriculture, Food Security, and Cooperatives, and the Department of Research, Training and Extension (DRTE) of the Ministry of Livestock Development and Fisheries (MLDF)–accounted for 63 percent of total agricultural R&D spending in Tanzania, compared with 53 percent during 2006 - 08. The nonprofit sector's share increased the most, from 3 percent during 1996 - 2000 to 10 percent in 2006 - 08. Other government and higher education agencies accounted for 20 and 17 percent of total spending, respectively, in 2006 - 08.
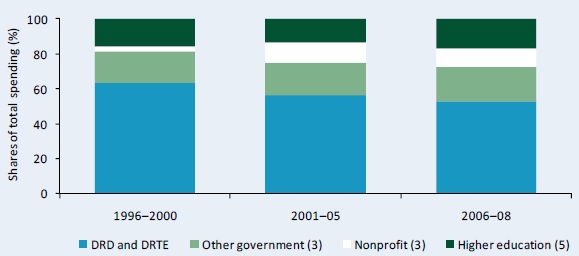
Source: Calculated by authors from ASTI - DRD 2009 - 10 and Beintema, Ngahulira, and Kirway 2003.
Notes: Figures in parentheses indicate the number of agencies in each category. Calculations are based on five-year averages–with the exception of 2006 - 08, a three-year average.
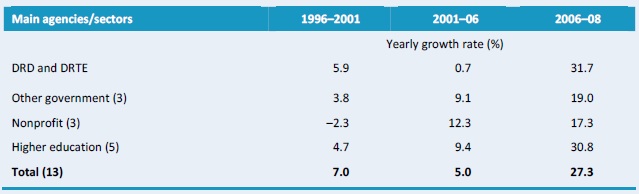
Table A2–Yearly rates of R&D spending growth by institutional category, 1996 - 2008
Annual growth rates in agricultural R&D expenditures slightly fell from 7 to 5 percent from the late 1990s to the beginning of the millennium before achieving a growth rate of 27 percent during 2006 - 08. Positive growth rates were reported across every agency in 2006-08 except the Tobacco Research Institute of Tanzania (TORITA) which experienced a decline of -24 percent per year. DRTE had the highest growth rate during this period (60 percent). This strong growth was the result of its recent establishment. Although DRTE was established in 2001 when all livestock capacity was transferred from DRD, it became operationally independent in 2006.
Source: Calculated by authors from ASTI - DRD 2009 - 10; Beintema, Ngahulira, and Kirway 2003; and UDSM various years.
Notes: Figures in parentheses indicate the number of agencies in each category. Expenditures for the five higher education agencies were estimated. Yearly growth rates were calculated using the least-squares regression method. See asti.cgiar.org/tanzania/datacoverage for more information.
.
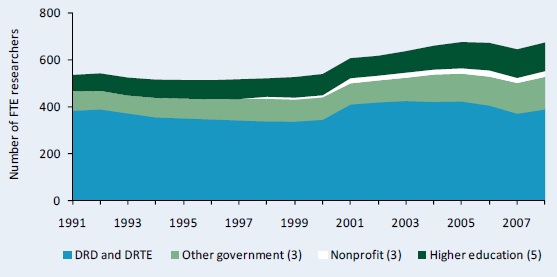
Figure A4–Public agricultural research staff in full-time equivalents, 1991 - 2008
Tanzania's agricultural research capacity declined slightly during the 1990s but began to rise in the early 2000s, reaching 675 researchers in full-time equivalents (FTEs) in 2006. Staffing levels fell in 2007 due to the retirement of a number of staff, but by 2008 agricultural researcher numbers totaled 674 FTEs, mainly due to the recruitment of BSc-qualified scientists. Large variations occurred across agencies, with some recording net increases, and others net decreases.
Source: Calculated by authors from ASTI - DRD 2009 - 10; Beintema, Ngahulira, and Kirway 2003; and UDSM various years.
Notes: Figures in parentheses indicate the number of agencies in each category. Data also include expatriate staff employed at DRD during the 1990s.
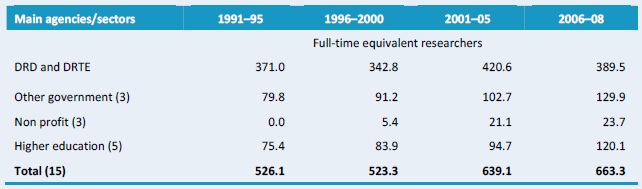
Table A3–Public agricultural research staffing in full-time equivalents, 1991 - 2008
Disaggregated data illustrate that Tanzania's research capacity grew stronger between 1991 and 2008. Total researcher numbers increased from an average of 526 FTEs during 1991 - 95 to 663 FTEs during 2006 - 08. DRD and DRTE, however, decreased in size, from an average of 421 FTE researchers in 2001 - 05 to 390 in 2006 - 08.
Source: Calculated by authors from ASTI - DRD 2009 - 10; Beintema, Ngahulira, and Kirway 2003; and UDSM various years.
Notes: Figures in parentheses indicate the number of agencies in each category. Calculations are based on five-year averages, with the exception of 2006 - 08–a three-year average.
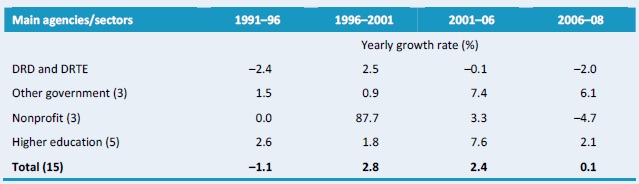
Table A4–Yearly rates of growth in agricultural R&D researcher numbers by institutional category, 1991 - 2008
Overall, the average rate of growth in agricultural researcher numbers in Tanzania was positive from the late-1990s. The total number of researchers grew by 2.4 percent per year during 2001 - 06 and by 0.1 percent per year during 2006 - 08. While the main government agencies and nonprofit agencies went through periods of positive and negative growth during this timeframe, the other government and higher education agencies maintained positive growth throughout the period.
Source: Calculated by authors from ASTI - DRD 2009 - 10; Beintema, Ngahulira, and Kirway 2003; and UDSM various years.
Notes: Figures in parentheses indicate the number of agencies in each category. Annual growth rates were calculated using the least-squares regression method.
Figure A5–Shares of public agricultural researchers by institutional category, 1991 - 2008
Due to the increased role of other government, nonprofit, and higher education agencies in Tanzanian agricultural R&D over time, DRD and DRTE's share of total researchers (in FTEs) declined from 71 percent during 1991 - 95 to 59 percent during 2006 - 08. During this time, other government agencies accounted for 20 percent of all FTE researchers, the nonprofit sector accounted for 4 percent, and the higher education agencies accounted for 18 percent.
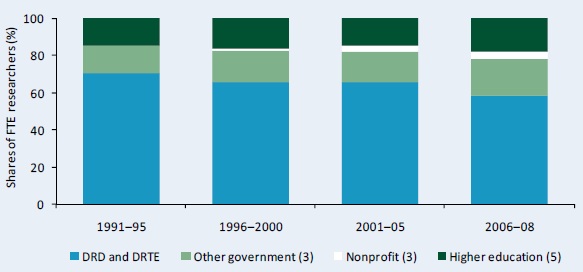
Source: Calculated by authors from ASTI - DRD 2009 - 10; Beintema, Ngahulira, and Kirway 2003; and UDSM various years.
Notes: Figures in parentheses indicate the number of agencies in each category. Calculations are based on five-year averages–with the exception of 2006 - 08, a three-year average.
Table A5–Various agricultural research intensity ratios, 1991 - 2008
Total public spending on agricultural research as a percentage of agricultural output (AgGDP)–known as the research intensity ratio–varied significantly in Tanzania during 1991 - 2008 due to fluctuations in agricultural research spending. The ratio fell to an average yearly low of 0.29 in 2001 - 05 but rose to 0.41 in 2006 - 08, indicating that for every $100 of agricultural output, $0.41 was invested in agricultural R&D. Starting in the early 1990s, the number of agricultural FTE researchers fell compared with the increasing number of farmers, despite some improvement during the 2000s. In 2006 - 08, Tanzania employed an average of 42 agricultural researchers per million farmers.
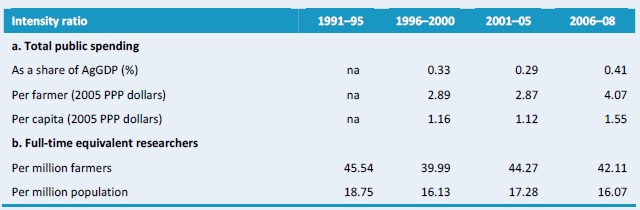
Source: Calculated by authors from ASTI - DRD 2009 - 10; Beintema, Ngahulira, and Kirway 2003; and UDSM various years.
Notes: Calculations are based on five-year averages–with the exception of 2006 - 08, a three-year average. Research spending as a share of AgGDP is calculated using a weighted average. Farmers are defined as population economically active in agriculture, an FAO classification.
Copyright (C) 2011 International Food Policy Research Institute and Department of Research and Development. Sections of this Data in Focus issue may be reproduced without the express permission of, but with acknowledgement to, IFPRI and DRD. This series has been prepared as an output for the ASTI initiative and has not been peer reviewed. Any opinions stated herein are those of ASTI and do not necessarily reflect the policies and opinions of IFPRI or DRD.