““ASTI Data in Focus” provides additional facts, figures, and tables in support of the 2010 Country Note on Senegal (asti.cgiar.org/pdf/Senegal-Note.pdf) prepared by ASTI and the Senegalese Agricultural Research Institute (ISRA).
Using data collected by ASTI and ISRA, the Country Note and the “ASTI Data in Focus” series review major investment and capacity trends in Senegalese public agricultural research and development (R&D) since 1976. These outputs provide important updates on agricultural R&D trends prepared by ASTI and ISRA during 2000–03.
C. Human Resources
This section provides detailed quantitative information on full-time equivalent (FTE) agricultural research and support staff trends including qualifications, gender and age distribution, and support-staff-per-researcher ratios. Supplementary sections present detailed data on long-term trends (Section A), financial resources (Section B) and research allocation (Section D). Other supporting information provides macroeconomic trends, a list of agencies included in the study, data sources and estimation procedures, and ASTI’s methodology.
Figure C1—Research staff trends at ISRA by degree (in full-time equivalents), 1991–2008
Consistent with decreased funding, ISRA’s research capacity decreased from 112 FTE researchers in 1991 to 92 in 2008. Despite this loss, the number of PhD-qualified researchers increased from 29 in 1991 to 54 in 2008. The long-term increase in PhD researchers hides a discomforting recent development. In 2003, ISRA employed 70 PhD-qualified researchers—16 FTEs more than in 2008. Some of these researchers left for more lucrative opportunities elsewhere while others simply
retired.
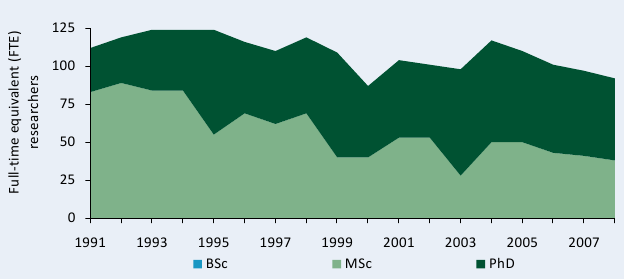
Sources: Calculated by authors from IFPRI–ISRA 2008/09 and Stads and Sène 2004.
Note: Research staff excludes expatriate staff active at ISRA.
Figure C2—Full-time equivalent researcher trends at ITA by degree, 1991–2008
From 1991 to 2008, the number of FTE researchers at ITA varied widely. In 1991, 90 percent of ITA’s research capacity held post-graduate degrees compared with 100 percent in 2001. Similar to ISRA, the number of PhD-qualified researchers at ITA declined in recent years. In 2008, ITA employed 3.0 FTE researchers holding PhD degrees, representing a decrease of more 50 percent since 2004 when ITA employed 6.5 FTE researchers holding PhDs.
.
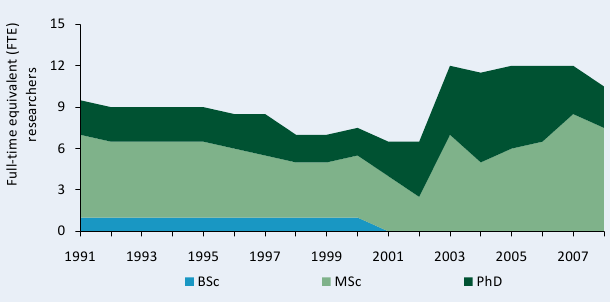
Sources: Calculated by authors from IFPRI–ISRA 2008/09 and Stads and Sène 2004.
Note: Research staff exclude expatriate staff employed at ITA during the 1990s. No expatriate staff were active since 2001. Staff at ITA spent 50 percent of their time on research, resulting in 10.5 FTE researchers in 2008.
Figure C3—Full-time equivalent researcher trends at seven higher education agencies by degree, 2001–08
In contrast to ISRA and ITA, the seven higher education agencies experienced steady increases in research capacity. Following major donor-financed training initiatives, the higher education agencies increased their number of MSc and PhD-trained researchers. In 2001, higher education agencies employed 21.4 FTE researchers compared with 32.6 in 2008. Many of these researchers entered higher education agencies after leaving ISRA and ITA.
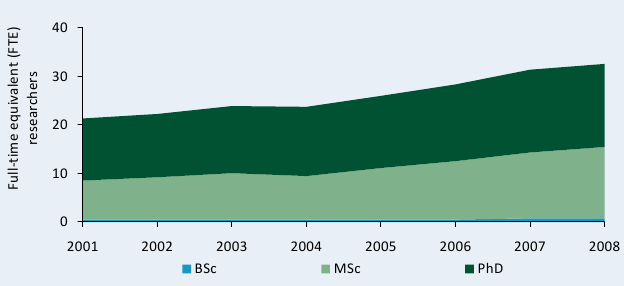
Source: Calculated by authors from IFPRI–ISRA 2008/09.
Note: Staff at the seven higher education agencies spent between 19 and 60 percent of their time on research, resulting in 32.6 FTE researchers in 2008.
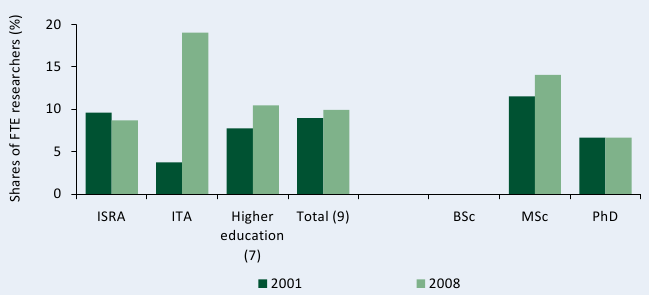
Figure C4—Distribution of researcher qualifications by institutional category, 2003 and 2008
This figure shows the relative levels of researcher qualifications for 2003 and 2008 at ISRA, ITA, and seven higher education agencies in addition to the absolute levels in Figures C1-3. In 2008, all three agency groups had a lower share of PhD researchers compared to 2003. Only higher education agencies employed BSc qualified FTE researchers in either year. ISRA and ITA did employ BSc holders, but they are classified as technicians (see also Figure C7).
.
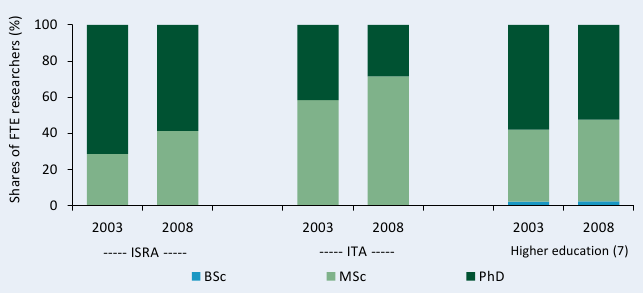
Source: Calculated by authors from IFPRI–ISRA 2008/09.
Notes: Figures in parentheses indicate the number of agencies in each category.
Figure C5—Female share of researchers by degree and institutional category, 2001 and 2008
The share of women in total FTE research staff increased slightly from 2001 to 2008, but women remained under-represented. In 2008, of the 135.1 FTE researchers for which gender data was available, only 13.4 were female. ITA had the highest share of female researchers at 19 percent. By degree level, women holding PhDs remained at 7 percent.
Source: Calculated by authors from IFPRI–ISRA 2008/09.
Note: Figures in parentheses indicate the number of agencies in each category.
Figure C6— Distribution of researcher qualifications by gender, 2001 and 2008
This figure shows the relative level of researcher qualifications by gender for 2001 and 2008. The share of PhD-holders in total number of male researchers increased from 46 to 57 percent during this period. The share of PhDs in total female research staff, however, remained constant at 37 percent.
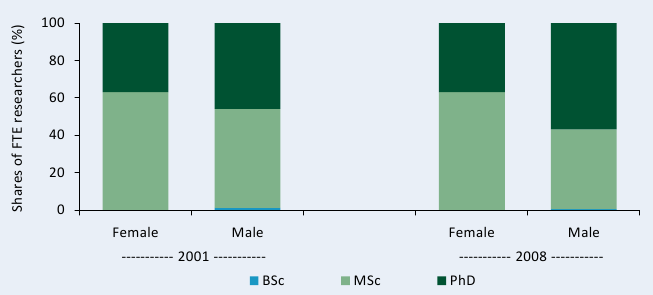
Source: Calculated by authors from IFPRI–ISRA 2008/09.
Note: See Figure C5 for agency sample size.
Figure C7— Full-time equivalent researcher qualifications by gender, 2001 and 2008
This figure shows the number of male and female FTE researchers in absolute terms. In 2001, there were 123.1 FTE male researchers compared with 12.0 FTE females. Female researchers continued to be under-represented in 2008, only accounting for 13.4 of the 135.1 total FTE researchers.
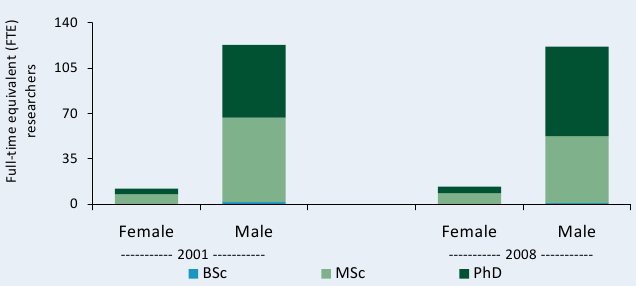
Sources: Calculated by authors from IFPRI–ISRA 2008/09.
Note: See Figure C5 for agency sample size.
Figure C8— Age distribution by agency and gender, 2007 (calculated by headcount)
This figure shows the age distribution at ISRA, ITA, and ENSA by agency and by gender. At these three agencies, the large majority of researchers were over the age of 40 in 2007. Over half were between the ages 51 and 60. This aging pool of well-qualified researchers, many of whom will retire in the next decade, is a major area of concern. Male researchers are older than their female colleagues. In 2007, 63 percent of the men were between the ages of 51 and 60 compared with only 24 percent of women.
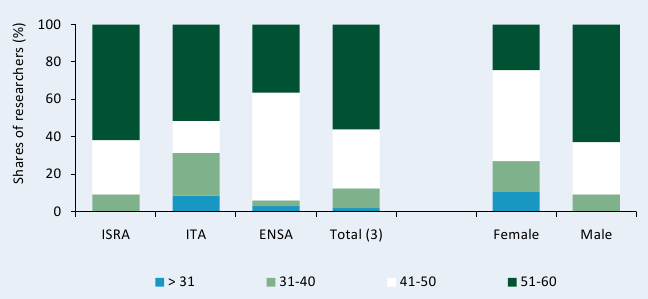
Sources: Calculated by authors from ASTI-AWARD 2008/09.
Figure C9— Full-time equivalent researcher and technician trends at ISRA, 2001–08
Despite a decline in FTE researchers, the number of technicians with BSc degrees increased from 2001 to 2008 as a result of large-scale recruitment efforts. In 2008, ISRA employed 105 FTE technicians holding BSc degrees compared with 79 in 2001.
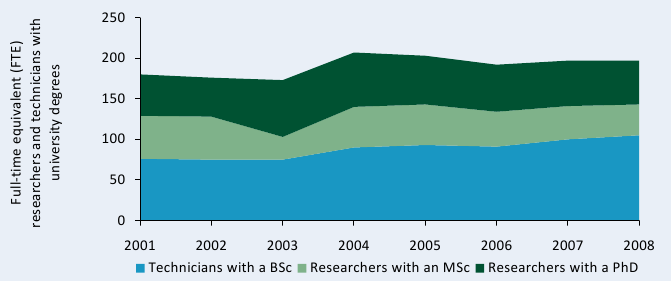
Source: Calculated by authors from IFPRI–ISRA 2008/09.
Note: Research staff exclude expatriate staff active at ISRA.
Figure C10— Trends in full-time equivalent support staff, 2001–08
The number of FTE technicians holding a BSc or MSc degree, as well as other support staff, increased during 2001-08 while technicians without university degrees declined. In 2008, a total of 536 FTE support staff were employed at the 9 agencies, compared with 401 FTEs in 2001.
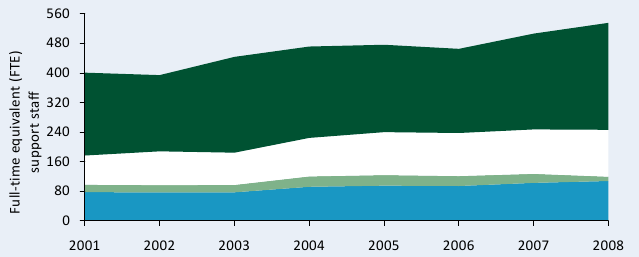
Sources: Calculated by authors from IFPRI–ISRA 2008/09.
Figure C11— Support-staff-per-researcher ratio by institutional category, 2001 and 2008
ISRA’s support-staff-to-researcher ratio increased substantially from 2001 to 2008 as a result of a recruitment campaign for support staff and a decline in the number of FTE researchers. In contrast, the support-staff-per-researcher ratios among the other agencies declined during the same period. The seven higher education agencies had the lowest support-staff-per researcher ratio in 2008 at 0.8. Lower ratios of support staff are common in the higher education sector, however, given that research is not its primary mandate.
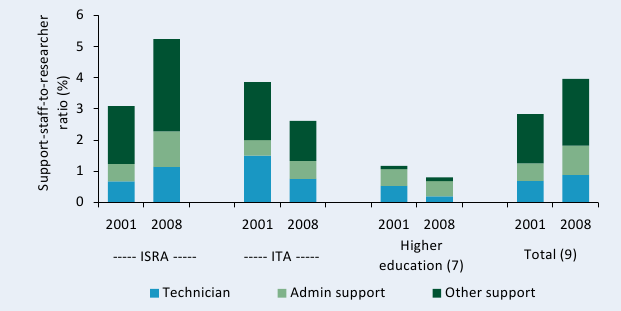
Sources: Calculated by authors from IFPRI–ISRA 2008/09
Notes: Figures in parentheses indicate the number of agencies in each category. For more information on coverage and estimation procedures, see the Senegal country page on ASTI’s website at asti.cgiar.org/senegal/datacoverage