“ASTI Data in Focus” provides additional facts, figures, and tables in support of the 2010 Country Note on Senegal (asti.cgiar.org/pdf/Senegal-Note.pdf) prepared by the Agricultural Science and Technology Indicators (ASTI) initiative and the Senegalese Agricultural Research Institute (ISRA).
Using data collected by ASTI and ISRA, the Country Note and the “ASTI Data in Focus” series review major investment and capacity trends in Senegalese public agricultural research and development (R&D) since 1976. These outputs provide important updates on agricultural R&D trends prepared by ASTI and ISRA during 2000–03.
B. Financial resources
This section provides detailed quantitative information on expenditure and funding sources for the period 1991-2008 for Senegal’s two government agricultural R&D agencies: the Senegalese Agricultural Research Institute (ISRA) and the Food Technology Institute (ITA). Supplementary sections present detailed data on long-term trends (Section A), human resources (Section C), and research allocation (Section D). Other supporting information provides macroeconomic trends, a list of agencies included in the study, data sources and estimation procedures, and ASTI’s methodology.
Figure B1—ISRA’s spending by cost-category adjusted for inflation, 1991-2008
From 1991 to 2008, ISRA spent on average half of its budget on salaries, 40 percent on operational costs, and 11 percent on capital expenses. However, with decreasing researcher numbers total salary expenditures steadily decreased. Capital costs fluctuated in line with donor funding. Two subsequent World Bank projects provided funds for the rehabilitation and upgrade of ISRA’s research infrastructure, which explains the peak during the early 1990s and the increase in capital costs during the early 2000s (for details on the World Bank projects see asti.cgiar.org/pdf/Senegal-Note.pdf).
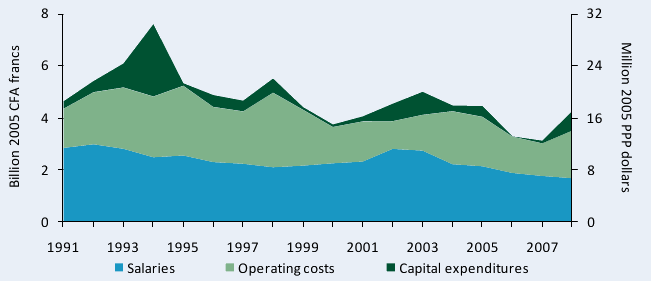
Sources: : Calculated by authors from IFPRI–ISRA 2008/09 and Stads and Sène 2004.
Notes: Salaries exclude those of expatriate staff active at ISRA. For more information on coverage and estimation procedures, see the Senegal country page on ASTI’s website at asti.cgiar.org/senegal/datacoverage.
Figure B2—ITA’s spending by cost-category adjusted for inflation, 1991-2008
Expenditure shares at ITA throughout 1991-2008 were similar to those of ISRA with salaries accounting, on average, for 50 percent, operating costs 32 percent and capital spending 18 percent of total expenditures. Capital costs also fluctuated as a result of funding for the upgrade of ITA’s research facilities through the two subsequent World Bank projects.
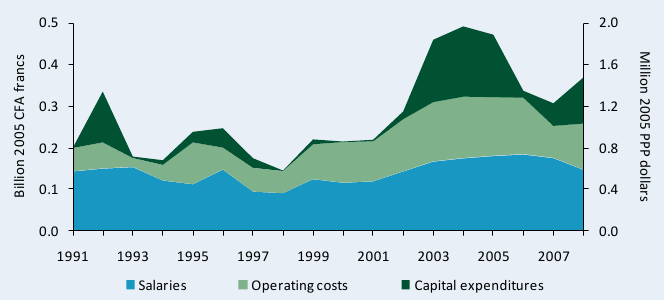
Sources: Calculated by authors from IFPRI–ISRA 2008/09 and Stads and Sène 2004.
Note: Salaries exclude those of one expatriate staff active at ITA during the late 1990s.
Figure B3—Distribution of ISRA and ITA’s spending by cost-category, 1991-2008
This figure shows the relative level of ISRA and ITA’s spending by cost-category in addition to the presentation in absolute levels in Figures B1 and B2. The variation in the share of salaries, operational, and capital costs is the result of the aforementioned high increases in capital spending during the early 1990s and early 2000s.
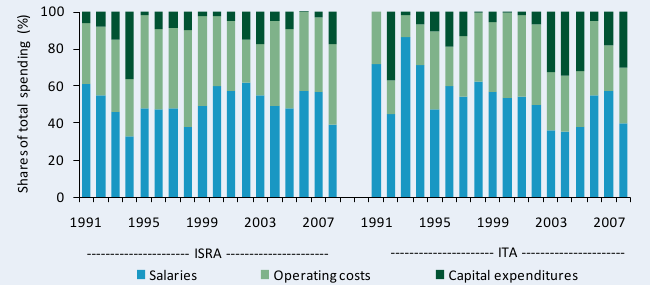
Sources: Calculated by authors from IFPRI–ISRA 2008/09 and Stads and Sène 2004.
Note: Salaries exclude those of expatriate staff.
Figure B4—ISRA’s funding sources adjusted for inflation, 1991-2008
The World Bank has been involved in the development of Senegal’s agricultural research since the mid-1990s. However, funding support from donors and development banks has fallen substantially at ISRA in absolute terms, although increased in recent years. After reaching a peak in 1994 of 9.9 billion CFA francs or 39.4 million PPP dollars, support from donors and development banks fell to 7.3 billion CFA francs or 28.9 million PPP dollars in 1998 (all in 2005 prices). Funding from the Senegalese government and sales of goods and services remained fairly constant in absolute terms and failed to fill the gap left by donors and development banks. During 1991-2008, sales of goods and services accounted for an average of 11 percent of ISRA’s funding.
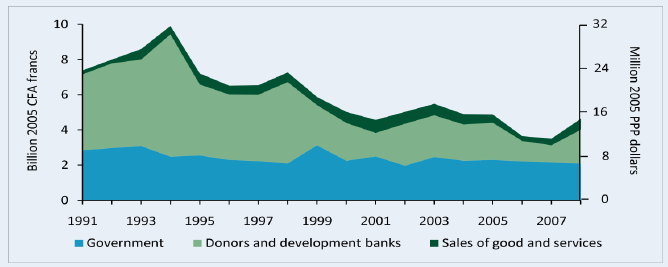
Sources: Calculated by authors from IFPRI–ISRA 2008/09 and Stads and Sène 2004.
Note: Donor funding includes the salaries of expatriate staff active at ISRA.
Figure B5—ITA’s funding sources adjusted for inflation, 2000-08
Since 2000, funding support from the national government, donors and development banks, and revenues from sales of goods and services increased by 76 percent. In 2000, ITA’s total funding amounted to 0.23 billion CFA francs or 1.00 million PPP dollars compared to 0.4 billion CFA francs or 1.6 million PPP dollars in 2008 (all in 2005 prices). ITA’s most important contributor since 2000 has been the World Bank. Sales of goods and services accounted for an average of 9 percent of ITA’s total funding during the 2000-08 period.
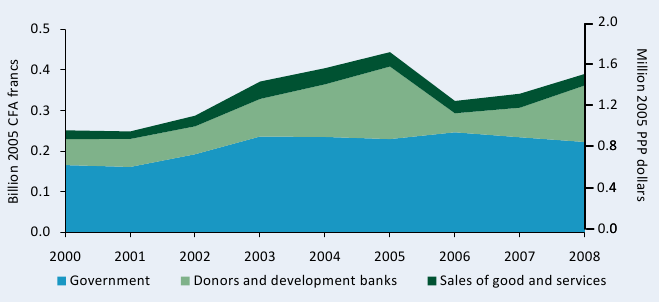
Sources: Calculated by authors from IFPRI–ISRA 2008/09 and Stads and Sène 2004.
Note: ITA did not employ any expatriate researchers after 2000.
Figure B6—Distribution of ISRA and ITA’s funding sources, 2000-08
This figure shows the relative level of ISRA and ITA’s funding sources in addition to the presentation in absolute levels in Figures B4 and B5. Government contributions remained the main source of funding for both agencies from 2000-08. Also, this figure shows the aforementioned variation in donor contributions from one year to the next.
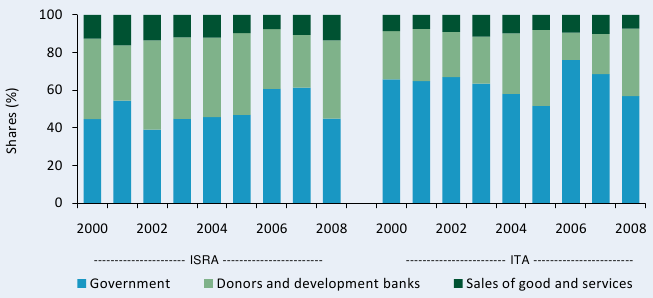
Sources: Calculated by authors from IFPRI–ISRA 2008/09 and Stads and Sène 2004.
Note: Donor funding includes the salaries of expatriate staff employed at ISRA and ITA.