Using data collected by ASTI and ISRA, the Country Note and the “ASTI Data in Focus” series review major investment and capacity trends in Senegalese public agricultural research and development (R&D) since 1976. These outputs provide important updates on agricultural R&D trends prepared by ASTI nd ISRA during 2000–03.
A. Long Term Trends
This section provides detailed quantitative information on long-term investment and capacity trends in Senegalese public agricultural R&D for the period 1976–2008. Subsequent sections present detailed data on financial resources (Section B), human resources (Section C), and research allocation (Section D). Other supporting information provides macroeconomic trends, a list of agencies included in the study, data sources and estimation procedures, and ASTI’s methodology.
Figure A1—Public agricultural R&D spending adjusted for inflation, 1976–2008
Overall, when adjusted for inflation, public spending on agricultural R&D in Senegal has fallen gradually over time due to reduced donor support and cuts in government funding. Although spending at the Senegalese Agricultural Research Institute (ISRA) increased somewhat during 2008, in real terms the institute’s spending levels were about a third of those recorded in the mid-1980s when the institute received considerable funding through a World Bank loan. Agricultural R&D spending levels at the Food Technology Institute (ITA) have exhibited a more erratic trend over the past 25 years.
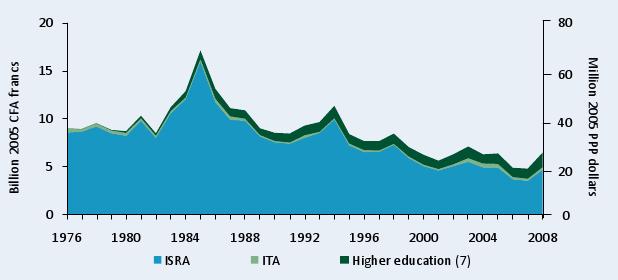
Sources: Calculated by authors from IFPRI–ISRA 2008/09 and Stads and Senè 2004.
Notes: Figures in parentheses indicate the number of agencies in each category. For more information on coverage and estimation procedures, see the Senegal country page on ASTI’s website at asti.cgiar.org/senegal/datacoverage
Figure A2—Public agricultural R&D spending in current CFA francs, 1976–08
Since the mid-1990s, public spending on agricultural R&D in Senegal has been comparatively stable in current prices (with the exception of 2005–06), but it has not kept pace with national inflation rates (see Figure A1).
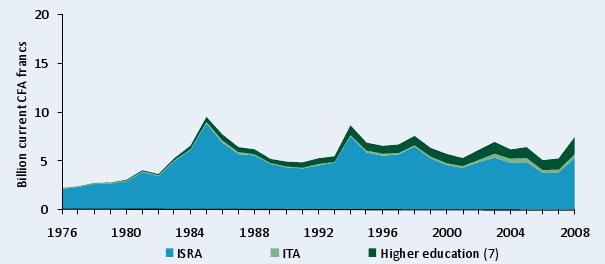
Sources: Calculated by authors from IFPRI–ISRA 2008/09 and Stads and Senè 2004.
Notes: Figures in parentheses indicate the number of agencies in each category.
Table A1—Public agricultural research spending, 1976–2008
The underlying data show that total spending on public agricultural R&D in Senegal during 2006–08 averaged 5.4 billion CFA francs or 21.6 million PPP dollars per year (both in constant 2005 prices), which is well below the levels recorded in the 1980s and 1990s. By way of comparison, Senegal spent an average of 12 billion CFA francs or 48 million billion PPP dollars per year on public agricultural R&D in the early 1980s.
1976–80 | 1981–85 | 1986–90 | 1991–95 | 1996–2000 | 2001–05 | 2006–08 | |||
a. Billion 2005 CFA francs |
| ||||||||
Government |
|
| |||||||
ISRA | 8.6 | 11.3 | 9.4 | 8.2 | 6.2 | 5.0 | 3.9 | ||
ITA | 0.4 | 0.3 | 0.3 | 0.2 | 0.2 | 0.4 | 0.3 | ||
Subtotal (2) | 9.0 | 11.6 | 9.7 | 8.4 | 6.5 | 5.4 | 4.3 | ||
Higher education (7) | — | 0.5 | 0.8 | 1.0 | 1.0 | 1.0 | 1.2 | ||
Total (9) | 9.0 | 12.0 | 10.6 | 9.5 | 7.5 | 6.4 | 5.4 | ||
b. Million 2005 PPP dollars |
| ||||||||
Government |
|
|
|
|
|
|
| ||
ISRA | 34.2 | 44.8 | 37.4 | 32.6 | 24.8 | 19.8 | 15.6 | ||
ITA | 1.6 | 1.3 | 1.2 | 0.9 | 0.9 | 1.6 | 1.3 | ||
Subtotal (2) | 35.8 | 46.1 | 38.6 | 25.7 | 25.7 | 21.3 | 17.0 | ||
Higher education (7) | 0.2 | 1.9 | 3.4 | 3.9 | 3.9 | 4.1 | 4.6 | ||
Total (9) | 36.0 | 48.0 | 42.0 | 29.6 | 29.6 | 25.4 | 21.6 | ||
Sources: Calculated by authors from IFPRI–ISRA 2008/09 and Stads and Senè 2004.
Notes: All calculations are based on five-year averages, with the exception of 2006–08—a three-year average. Figures in parentheses indicate the number of agencies in each category.
Figure A3—Shares of public agricultural R&D spending by institutional category, 1976–2008
During 2006–08, ISRA accounted for 72 percent of Senegal’s total agricultural R&D spending, compared with 96 percent in the late-1970s. This decline resulted from reduced spending by ISRA and growth in the amount of research conducted by the higher education sector.
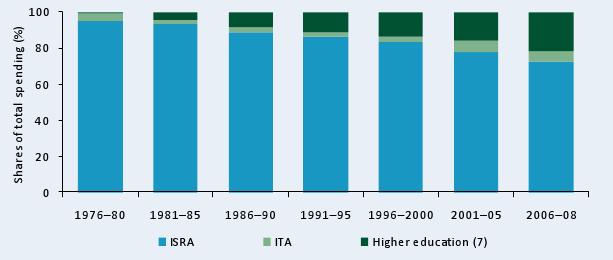
Sources: Calculated by authors from IFPRI–ISRA 2008/09 and Stads and Senè 2004.
Notes: All calculations are based on five-year averages, with the exception of 2006–08—a three-year average. Figures in parentheses indicate the number of agencies in each category.
Table A2—Annual rates of R&D spending growth by institutional category, 1976–2008
Agricultural R&D spending in Senegal grew by more than 10 percent per year during the early 1980s, during which time the country’s public agricultural R&D was heavily supported by a World Bank loan. Thereafter, Senegal reported negative annual growth rates until 2006–08. Although increased spending in 2008 raised growth levels for this most recent period, real spending was still lower on average than in prior years.
Main agencies/sectors | 1976–81 | 1981–86 | 1986–91 | 1991–96 | 1996–2001 | 2001–05 | 2006–08 |
Percentage growth rate | |||||||
ISRA | 1.3 | 9.3 | –9.0 | –2.2 | –7.6 | –3.7 | 12.8 |
ITA | –3.6 | 1.6 | –16.1 | 3.0 | 1.1 | 9.3 | 4.7 |
Higher education (7) | –36.0 | 40.1 | –1.9 | 0.5 | –0.8 | 1.2 | 25.9 |
Total (9) | 1.4 | 10.3 | –8.6 | –1.8 | –6.4 | –2.2 | 14.9 |
Sources: Calculated by authors from IFPRI–ISRA 2008/09 and Stads and Senè 2004.
Notes: Annual growth rates were calculated using the least-squares regression method. Figures in parentheses indicate the number of agencies in each category.
Figure A4—Public agricultural research staff in full-time equivalents, 1976–2008
The total number of agricultural research staff in full-time equivalents peaked in 1986 and declined steadily thereafter due to staffing reductions at ISRA. This trend reflects the retirement of many senior scientists and the loss of senior staff to universities, nongovernmental institutions, and other organizations able to offer more lucrative opportunities.
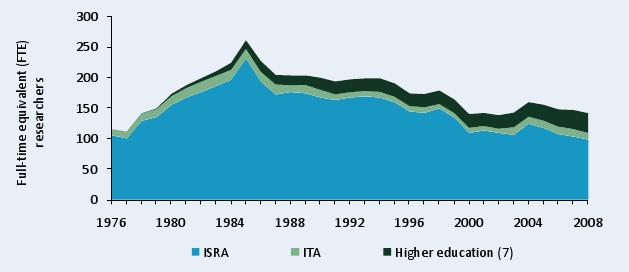
Sources: Calculated by authors from IFPRI–ISRA 2008/09 and Stads and Senè 2004.
Notes: Figures in parentheses indicate the number of agencies in each category.
Table A3—Public agricultural research staffing in full-time equivalents, 1976–2008
Disaggregated data show the deterioration of Senegal’s research capacity over time. Total researcher numbers in full-time equivalents (FTEs) fell from an average of more than 200 in the 1980s to 145 during 2006–08.
Main agencies/sectors | 1976–80 | 1981–85 | 1986–90 | 1991–95 | 1996–2000 | 2001–05 | 2006–08 |
Government | Full-time equivalent researchers | ||||||
ISRA | 124.8 | 191.2 | 176.4 | 165.0 | 135.6 | 113.8 | 102.7 |
ITA | 11.9 | 17.0 | 14.4 | 9.3 | 8.2 | 9.8 | 11.5 |
Subtotal (2) | 136.7 | 208.2 | 190.8 | 174.3 | 143.8 | 123.6 | 114.2 |
Higher education |
|
|
|
|
|
|
|
ENSA | 0.3 | 2.3 | 4.6 | 4.9 | 4.1 | 3.6 | 5.9 |
UCAD (2) | 0.6 | 6.0 | 11.5 | 12.0 | 12.6 | 13.3 | 14.7 |
UGB (4) | 0.0 | 0.0 | 0.7 | 4.4 | 5.2 | 6.6 | 10.2 |
Subtotal (7) | 0.8 | 8.3 | 16.8 | 21.3 | 21.9 | 23.5 | 30.8 |
Total (9) | 137.5 | 216.5 | 207.6 | 195.6 | 165.7 | 147.1 | 145.0 |
Sources: Calculated by authors from IFPRI–ISRA 2008/09 and Stads and Senè 2004.
Notes: All calculations are based on five-year averages, with the exception of 2006–08—a three-year average. Figures in parentheses indicate the number of agencies in each category. ENSA stands for the Advanced National School of Agriculture, UCAD for University Cheikh Anta Diop, and UGB for the University Gaston Berger.
Figure A5—Shares of public agricultural R&D staff numbers by institutional category, 1976–2008
Due to ISRA’s declining research capacity and the increased role of the higher education sector in agricultural research, ISRA’s share of total staff declined in full-time equivalents from 89 percent in 1976 to 69 percent in 2008.
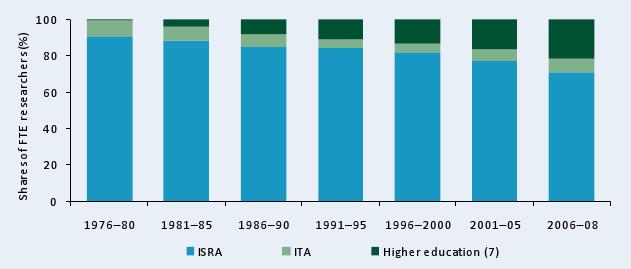
Sources: Calculated by authors from IFPRI–ISRA 2008/09 and Stads and Senè 2004.
Notes: All calculations are based on five-year averages, with the exception of 2006–08—a three-year average. Figures in parentheses indicate the number of agencies in each category.
Table A4—Annual rates of growth in R&D staff numbers by institutional category, 1976–2008
Agricultural R&D capacity grew by more than 5 percent per year during the early 1980s, but thereafter growth was negative. The exception to this trend is the higher education sector, which reported positive growth throughout the 1976–2008 period.
Main agencies/sectors | 1976–81 | 1981–86 | 1986–91 | 1991–96 | 1996–2001 | 2001–06 | 2006–08 |
Percentage growth rate | |||||||
ISRA | 11.1 | 4.7 | –2.7 | –2.2 | –5.9 | 0.3 | –4.3 |
ITA | 12.0 | 0.3 | –9.3 | –0.2 | –4.5 | 13.7 | –6.5 |
Higher education (7) | 35.5 | 33.9 | 4.7 | 0.4 | 0.8 | 5.5 | 7.2 |
Total (9) | 11.7 | 5.4 | –2.5 | –1.8 | –4.9 | 2.0 | –2.2 |
Sources: Calculated by authors from IFPRI–ISRA 2008/09 and Stads and Senè 2004.
Notes: Annual growth rates were calculated using the least-squares regression method. Figures in parentheses indicate the number of agencies in each category.
Table A5—Various agricultural research intensity ratios, 1976–2008
Total public spending as a percentage of agricultural output (AgGDP) steadily declined in response to dwindling R&D investments throughout most of the 1990s and 2000s. During 2006–08, Senegal invested an average of $0.84 on agricultural R&D for every $100 of agricultural output, or $1.82 per capita and $5.93 per farmer. For every million farmers, the country employed 40 full-time equivalent researchers.
Intensity ratio | 1981–85 | 1986–90 | 1991–95 | 1996–2000 | 2001–05 | 2006–08 |
a. Total public spending | ||||||
As a share of AgGDP (%) | 2.75 | 2.01 | 1.86 | 1.30 | 1.05 | 0.84 |
Per farmer (2005 PPP dollars) | 23.48 | 18.36 | 14.66 | 10.21 | 7.72 | 5.93 |
Per capita (2005 PPP dollars) | 7.80 | 5.90 | 4.59 | 3.16 | 2.37 | 1.82 |
b. Full-time equivalent researchers | ||||||
Per million farmers | 105.94 | 90.81 | 76.20 | 57.07 | 44.73 | 39.81 |
Per million population | 35.20 | 29.17 | 23.84 | 17.64 | 13.72 | 12.19 |
Sources: Calculated by authors from IFPRI–ISRA 2008/09, Stads and Senè 2004, FAO 2009, and World Bank 2009.
Notes: All calculations are based on five-year averages, with the exception of 2005–08—a three-year average. Farmers are economically active population in agriculture (FAO classification).