The ASTI Data in Focus series provides additional background data in support of the 2010 Country Note on Sudan (asti.cgiar.org/pdf/Sudan-Note.pdf asti.cgiar.org/pdf/Kenya-Note.pdf]) prepared by the Agricultural Science and Technology Indicators (ASTI) initiative and the Agricultural Research Corporation (ARC). Based on data collected by ASTI and ARC, these two outputs review major investment and capacity trends in Sudanese public agricultural research and development (R&D) since 1971, providing important updates on agricultural R&D trends prepared by ASTI and ARC in 2002 - 03.
Long-Term Trends
This section provides detailed quantitative information on long-term investment and capacity trends in Sudanese public agricultural R&D for the period 1971 - 2008. Subsequent sections present detailed data on financial resources (Section B), human resources (Section C), and research allocation (Section D). Other supporting information provides macroeconomic trends, a list of agencies included in the study, data sources and estimation procedures, and ASTI's methodology.
Figure A1–Public agricultural R&D spending adjusted for inflation, 1971 - 2008
Public spending on agricultural research and development (R&D) in Sudan fluctuated considerably during 1971?2008. In the early 1990s, investments declined rapidly, but this trend reversed in more recent years. Various reforms led to increased R&D investments, resulting in an increase in agricultural R&D expenditures from a low of 28 million Sudanese pounds or 26 million purchasing power parity (PPP) dollars in 2001, to 55 million pounds or 52 million PPP dollars in 2008 (both in 2005 constant prices).
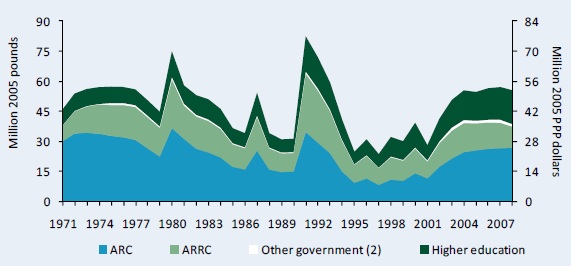
Source: Calculated by authors from ASTI - ARC 2010 and Beintema and Faki 2003.
Notes: Figures in parentheses indicate the number of agencies in each category. For more information on coverage and estimation procedures, see the Sudan country page on ASTI's website at asti.cgiar.org/sudan asti.cgiar.org/tanzania..
Figure A2–Public agricultural R&D spending in current pounds, 1991 - 2008
Public agricultural R&D spending increased steadily when expressed in current prices. In 2008, agricultural R&D expenditures reached 77 million pounds compared with 55 million adjusted for inflation (in 2005 prices).
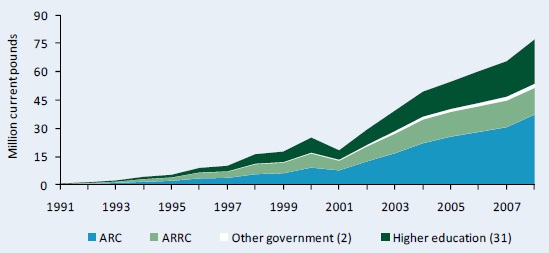
Source: Calculated by authors from ASTI - ARC 2010 and Beintema and Faki 2003.
Notes: Figures in parentheses indicate the number of agencies in each category. Because of high inflation rates, spending levels for the 1970s and 1980s could not be presented graphically.
Table A1–Public agricultural research spending, 1971 - 2008
During 2006 - 08 total agricultural R&D spending averaged 56 million pounds or 52 million PPP dollars compared with a historic low of 31 million pounds or 29 million PPP dollars during the late-1990s. While average spending decreased at ARC and ARRC from the early 1970s to 2006-08, significant increases in R&D spending took place at the other government and higher education agencies.
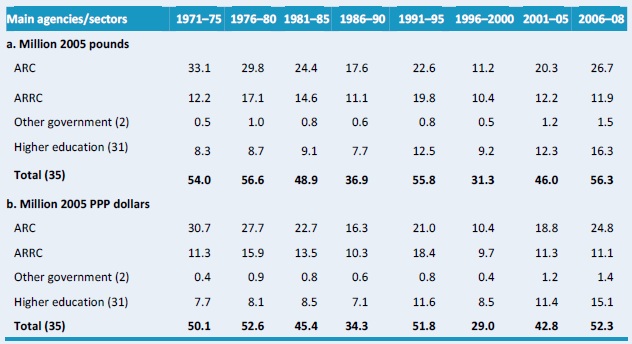
Source: Calculated by authors from ASTI - ARC 2010 and Beintema and Faki 2003.
Notes: Figures in parentheses indicate the number of agencies in each category. Calculations are based on five-year averages–with the exception of 2006 - 08, a three-year average.
Figure A3–Shares of agricultural R&D spending by institutional category, 1971 - 2008
The Agricultural Research Corporation (ARC) is Sudan's principal agricultural research institute, accounting for close to half of the country's public agricultural R&D expenditures in 2008. The institute regained some of its lost share from the late-1990s, when it dropped to 36 percent, below the high shares seen in 1970s.
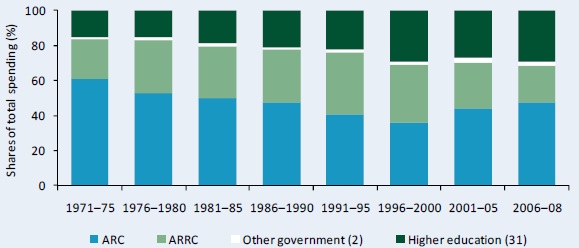
Source: Calculated by authors from ASTI - ARC 2010 and Beintema and Faki 2003.
Notes: Figures in parentheses indicate the number of agencies in each category. Calculations are based on five-year averages–with the exception of 2006 - 08, a three-year average.
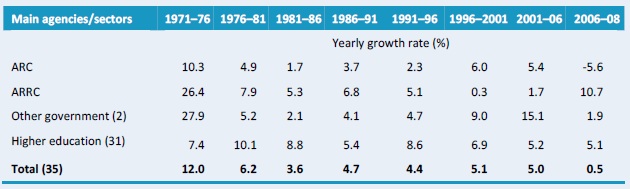
Table A2–Yearly rates of R&D spending growth by institutional category, 1971 - 2008
Yearly rates of agricultural R&D expenditure growth fell significantly in the early 1990s, but growth rebounded from 2000. From 2001 - 06 growth rates averaged 13 percent, thereafter becoming slightly negative during 2006 - 08, mainly due to decreased investment at ARRC.
Source: Calculated by authors from ASTI - ARC 2010 and Beintema and Faki 2003.
Notes: Figures in parentheses indicate the number of agencies in each category. Expenditures for the 31 higher education agencies were estimated. Annual growth rates were calculated using the least-squares regression method. See asti.cgiar.org/sudan/datacoverage asti.cgiar.org/tanzania/datacoverage for more information.
.
Figure A4–Public agricultural research staff in full-time equivalents, 1971 - 2008
Sudan's agricultural research capacity increased steadily from the 1970s then accelerated further after 1999, reaching more than 1,000 full-time equivalent (FTE) researchers in 2005. The country employed 1,020 FTEs in 2008, compared with 749 in 2000. As of 2008, Sudan had the fourthlargest pool of agricultural scientists in SubSaharan Africa, following Nigeria, South Africa, and Ethiopia. Large variations occurred across agencies, but almost all recorded a net increase between 2000 and 2008.
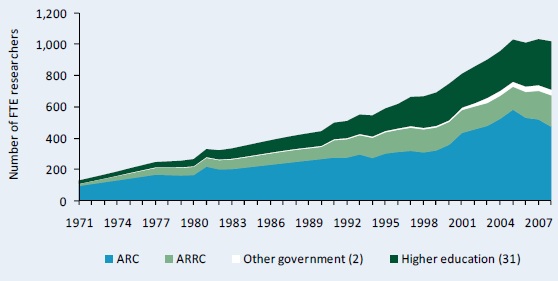
Source: Calculated by authors from ASTI - ARC 2010 and Beintema and Faki 2003.
Note: Figures in parentheses indicate the number of agencies in each category.
Table A3–Public agricultural research staffing in full-time equivalents, 1971 - 2008
Disaggregated data illustrate that Sudan's research capacity became significantly stronger during 1971 and 2008. Total researcher numbers increased from an average 167 FTEs during 1971 - 75 to 1022 FTEs during 2006 - 08.
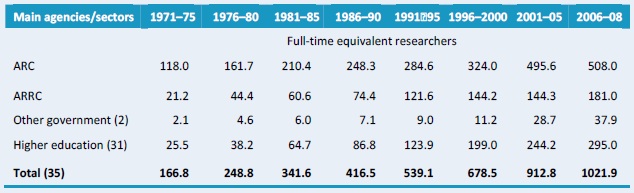
Source: Calculated by authors from ASTI - ARC 2010 and Beintema and Faki 2003.
Notes: Figures in parentheses indicate the number of agencies in each category. Calculations are based on five-year averages–with the exception of 2006 - 08, a three-year average.
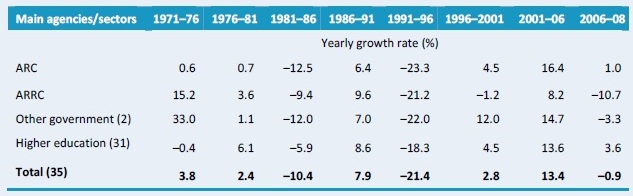
Table A4–Yearly rates of growth in agricultural researcher numbers by institutional category, 1971 - 2008
Overall, the average rate of growth in the number of agricultural researchers was positive across all agencies after the 1970s. The total number of researchers grew by 5.0 percent per year during 2001 - 06 but slowed to 0.5 percent per year during 2006 - 08 as a result of negative growth at ARC.
Source: Calculated by authors from ASTI - ARC 2010 and Beintema and Faki 2003.
Notes: Figures in parentheses indicate the number of agencies in each category. Yearly growth rates were calculated using the least-squares regression method.
Figure A5–Shares of public agricultural researchers by institutional category, 1971 - 2008
Due to the increased role of ARRC, other government, and higher education agencies in Sudanese agricultural R&D over time, ARC's share of total researchers (in FTEs) declined from 71 percent during 1971 - 75 to 50 percent during 2006 - 08. During this time ARRC accounted for 18 percent of researchers, other government agencies for 4 percent of researchers, and the higher education agencies for 29 percent of researchers.
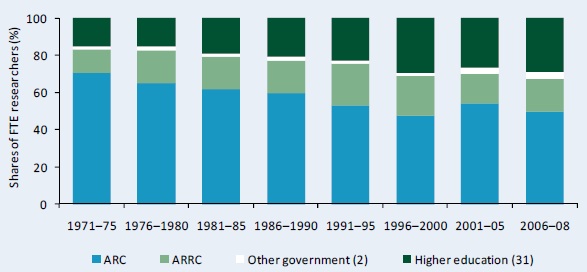
Sources: Calculated by authors from ASTI - ARC 2010 and Beintema and Faki 2003.
Notes: Figures in parentheses indicate the number of agencies in each category. Calculations are based on five-year averages–with the exception of 2006 - 08, a three-year average.
Table A5–Various agricultural research intensity ratios, 1971 - 2008
Total public spending on agricultural research as a percentage of agricultural output (AgGDP)–known as the research intensity ratio–varied significantly as a result of fluctuating agricultural research spending. The ratio fell rapidly in the late-1980s and 1990s, reaching a low of $0.12 in 1997. However, with subsequent recovery of investment levels, the ratio rose to 0.27 in 2006?08. In contrast, the number of agricultural researchers per million farmers more than doubled during 1981 - 2008, from 67 to 148 FTEs, indicating that agricultural researcher numbers grew more rapidly than did the number of farmers.
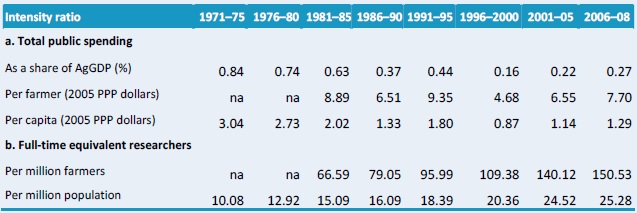
Source: Calculated by authors from ASTI - ARC 2010 and Beintema and Faki 2003.
Notes: Calculations are based on five-year averages–with the exception of 2006 - 08, a three-year average. Research spending as a share of AgGDP is calculated using a weighted average. Farmers are defined as population economically active in agriculture, an FAO classification.
Copyright (C) 2011 International Food Policy Research Institute and Agricultural Research Corporation. Sections of this Data in Focus issue may be reproduced without the express permission of, but with acknowledgement to, IFPRI and ARC. This series has been prepared as an output for the ASTI initiative and has not been peer reviewed. Any opinions stated herein are those of ASTI and do not necessarily reflect the policies and opinions of IFPRI or ARC.