The ASTI Data in Focus series provides additional background data in support of the 2010 Country Note on Burkina Faso(asti.cgiar.org/pdf/BurkinaFaso-Note.pdf) prepared by the Agricultural Science and Technology Indicators (ASTI) initiative and the Environment and Agricultural Research Institute (INERA). Based on data collected by ASTI and INERA, these two outputs review major investment and capacity trends in Burkina Faso’s public agricultural research and development (R&D) since 1971, providing important updates on agricultural R&D trends prepared by ASTI and INERA in 2003–04.
B. Financial Resources
This section provides detailed quantitative information on expenditures in Burkina Faso’s public agricultural R&D for the period 1991–2008. Complementary sections present detailed data on long-term trends (Section A), human resources (Section C), and research allocation (Section D). Other supporting information provides macroeconomic trends, a list of agencies included in the study, data sources and estimation procedures, and ASTI’s methodology.
Figure B1—INERA’s spending by cost-category adjusted for inflation, 1996–2008
From 1996 to 2008, spending on agricultural research and development (R&D) at the Environment and Agricultural Research Institute (INERA) has been rather erratic as a result of fluctuating levels of donor funding. In 2002, overall spending reached a peak of 5.9 billion CFA francs or 29.6 million PPP dollars (in 2005 prices). Capital expenditures accounted for 53 percent of total spending that year. After the completion of the World Bank loan financed National Agricultural Service Development Project (PNDSA-II) in December 2002, capital expenditure levels declined sharply (for more details on the World Bank projects see asti.cgiar.org/pdf/burkina-faso-Note.pdf). In 2008, INERA spent 2.8 billion CFA francs or 14.1 million PPP dollars. Salaries accounted for 45 percent of this amount, and operating costs accounted for the remaining 55 percent. No capital investments were made during 2005–08.
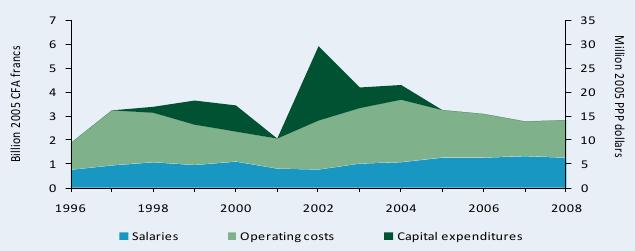
Sources: Calculated by authors from ASTI–INERA 2009–10 and Stads and Issa Boro 2004.
Notes: Salaries exclude those of expatriate research staff active at INERA from 1996 until 2000. For more information on coverage and estimation procedures, see the Burkina Faso country page on ASTI’s website at asti.cgiar.org/burkina-faso/datacoverage.
Figure B2—IRSAT’s spending by cost-category adjusted for inflation, 1998–2008
Similar to the spending trend at INERA, the Applied Science and Technology Research Institute (IRSAT) has experienced changing levels and composition of expenditures as result of changes in funding. Like INERA, IRSAT received large sums of funding through the World Bank’s PNDSA-II. The completion of this project in December 2002 led to a drop in overall spending levels. In 2008, IRSAT spent 0.4 billion CFA francs or 2.1 million PPP dollars on salaries and 0.2 billion CFA francs or 1.0 million PPP dollars on operating costs. The institute has not had any capital investments since the completion of PNDSA-II.
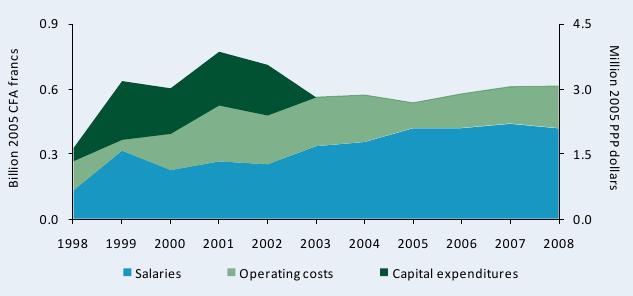
Sources: Calculated by authors from ASTI–INERA 2009–10 and Stads and Issa Boro 2004.
Notes: Salaries exclude those of expatriate research staff active at IRSAT from 1998 until 2001. For more information on coverage and estimation procedures, see the Burkina Faso country page on ASTI’s website at asti.cgiar.org/burkina-faso/datacoverage.
Figure B3—CNSF’s spending by cost-category adjusted for inflation, 1998–2008
From 1998 to 2008, salaries accounted for between 25 and 40 percent of expenditures at the National Forestry Seed Center (CNSF) except in 2003, when salaries reached 62 percent. In 2008, salaries accounted for 33 percent of total expenditures, operating costs 49 percent, and capital expenditures 18 percent.
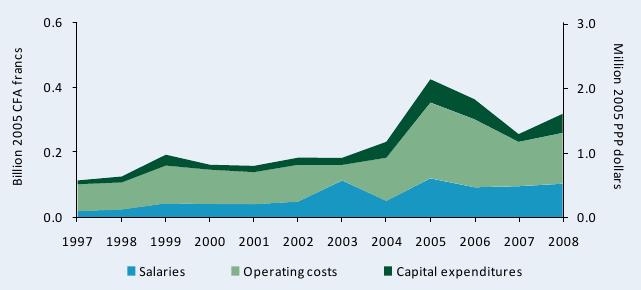
Sources: Calculated by authors from ASTI–INERA 2009–10 and Stads and Issa Boro 2004.
Notes: Salaries exclude those of expatriate research staff active at IRSAT from 1998 until 2001. For more information on coverage and estimation procedures, see the Burkina Faso country page on ASTI’s website at asti.cgiar.org/burkina-faso/datacoverage.
Figure B4—INERA’s funding sources adjusted for inflation, 1996–2008
The national governments as well as bilateral and multilateral donors are the primary sources of funding for INERA. However, the institute also generates funds internally by selling seeds and by providing training to producers. In 2008, the national government provided INERA with 1.3 billion CFA francs or 6.5 million PPP dollars, donors and development banks provided slightly less. The remaining 0.2 billion CFA francs or 1.0 million PPP dollars were generated internally by the aforementioned activities.
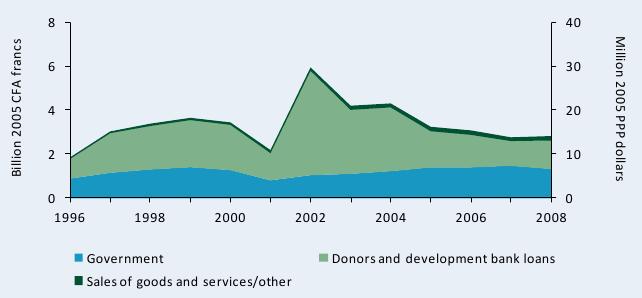
Sources: Calculated by authors from ASTI–INERA 2009–10 and Stads and Issa Boro 2004.
Note: Donor funding includes the salaries of expatriate staff active at INERA during 1996–2000.
Figure B5—IRSAT’s funding sources adjusted for inflation, 1998–2008
Since the completion of PNDSA-II in December 2002, IRSAT has faced lower levels of donor funding. In 2008, IRSAT received 0.3 billion CFA francs or 2.3 million PPP dollars in funding from the national government, 0.1 billion CFA francs or 0.7 million PPP dollars from donors and development banks, and the remainder was generated internally through the sale of goods and services.
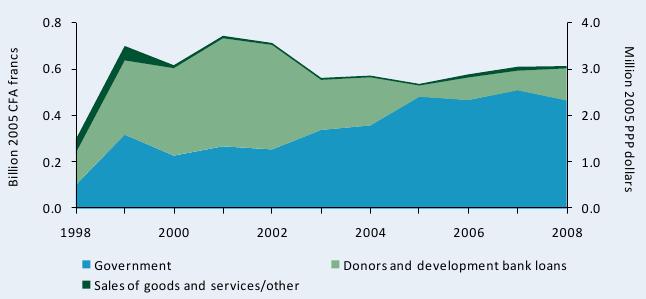
Sources: Calculated by authors from ASTI–INERA 2009–10 and Stads and Issa Boro 2004.
Note: Donor funding includes the salaries of expatriate staff active at IRSAT during 1998–2003.
Figure B6—CNSF’s funding sources adjusted for inflation, 2000–08
From 2000 to 2008, CNSF received its funding from the national government, donors and development bank loans, and sales of goods and services. The role of government funding became increasingly important during this period. In 2000, the national government funded 31 percent of CNSF’s research activities compared to 62 percent in 2008.
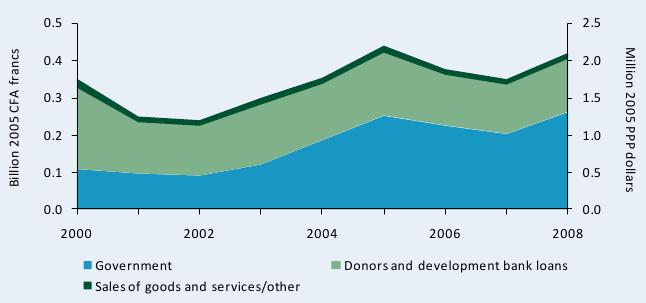
Source: Calculated by authors from ASTI–INERA 2009–10.