The ASTI Data in Focus series provides additional background data in support of the 2010 Country Note on Nigeria (asti.cgiar.org/pdf/Nigeria-Note.pdf) prepared by the Agricultural Science and Technology Indicators (ASTI) initiative, the Farm and Infrastructure Foundation (FIF), and the Agricultural Research Council of Nigeria (ARCN). Based on data collected by ASTI, FIF, and ARCN, these two outputs review major investment and capacity trends in Nigerian public agricultural research and development (R&D) since 1971, providing important updates on agricultural R&D trends prepared by ASTI in 2001 - 03.
C. Human Resources
This section provides detailed quantitative information on full-time equivalent (FTE) agricultural research and support staff trends including qualifications, gender and age distribution, and support-staff-per-researcher ratios. Supplementary sections present detailed data on long-term trends (Section A), financial resources (Section B) and research allocation (Section D). Other supporting information provides macroeconomic trends, a list of agencies included in the study, data sources and estimation procedures, and ASTI's methodology.
Table C1–Total researcher levels across various agencies, 2008
In 2008, the 15 national agricultural research institutes (NARIs) under the Agricultural Research Council of Nigeria (ARCN) accounted for 43 percent of Nigeria's agricultural research and development (R&D) capacity. The largest agency was the National Veterinary Research Institute (NVRI) with 140 full-time equivalent (FTE) researchers. The other government and higher education agencies accounted for 17 and 41 percent of the total agricultural R&D capacity, respectively. The largest higher education agencies, were the University of Nigeria (83 FTEs), Ahmadu Bello University (69 FTEs), and University of Ibadan (47 FTEs).
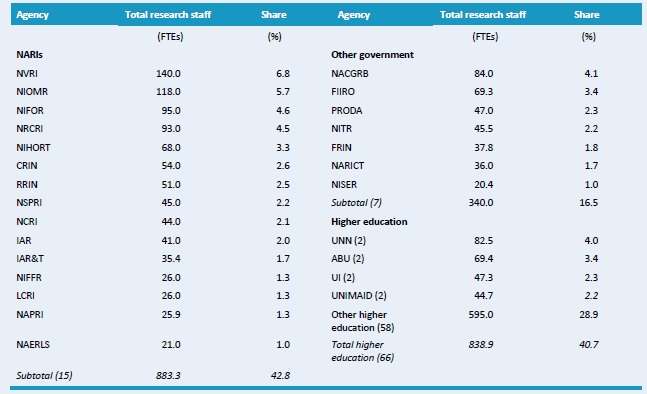
Source: Calculated by authors from ASTI-FIF-ARCN 2009 - 10.
Notes: Figures in parentheses indicate the number of agencies in each category Data for 38 higher education agencies were estimated using the agencies' combined 2000 share. For more information on coverage and estimation procedures, see the Nigeria country page on ASTI's website at asti.cgiar.org/nigeria/datacoverage. For full agency names see asti.cgiar.org/Nigeria/agencies.
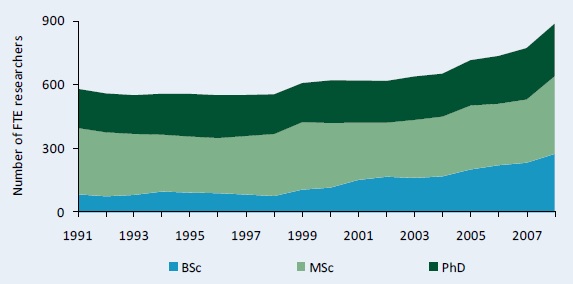
Figure C1–Research staff trends at NARIs by degree (in full-time equivalents), 1991 - 2008
The NARIs' research capacity increased from 578 FTE researchers in 1991 to 883 FTEs in 2008. The number of FTE researchers increased across all levels of qualifications, although a relatively higher number of the new researchers held BSc degrees. Accordingly, the share of BSc-holders in total research staff at the NARIs increased from 15 percent in 1991 to 31 percent in 2008.
Sources : Calculated by authors from ASTI-FIF-ARCN 2009 - 10 and Beintema and Ayoola 2004.
Notes: Figures in parentheses indicate the number of agencies in each category. For more information on coverage and estimation procedures, see the Nigeria country page on ASTI's website at asti.cgiar.org/nigeria/datacoverage.
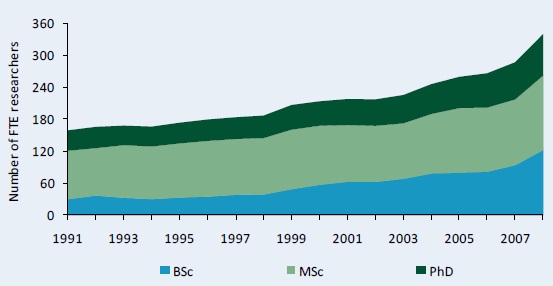
Figure C2–Full-time equivalent researcher trends at other government agencies by degree, 1991 - 2008
From 1991 to 2008, the number of researchers at the other government agencies increased from 159 to 340 FTEs. Similar to the NARIs, an increasing share of new researchers held BSc degrees. In 2008, 36 percent of FTE researchers held BSc degrees compared to 29 percent in 2001.
Sources : Calculated by authors from ASTI-FIF-ARCN 2009 - 10 and Beintema and Ayoola 2004.
Notes: Figures in parentheses indicate the number of agencies in each category. For more information on coverage and estimation procedures, see the Nigeria country page on ASTI's website at www.asti.cgiar.org/nigeria/datacoverage.
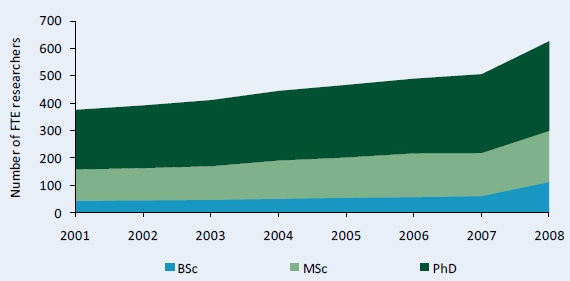
Figure C3–Full-time equivalent researcher trends at 28 higher education agencies by degree, 2001 - 08
From 2001 to 2008, the number of FTE researchers at the 28 higher education agencies for which degree data were available increased from 371 to 621. Across degree levels, PhD-qualified researchers increased from 183 to 245, MSc-qualified researchers increased from 312 to 364, and BSc-qualified researchers increased from 84 to 274.
Sources : Calculated by authors from ASTI-FIF-ARCN 2009 - 10 and Beintema and Ayoola 2004.
Notes: Figures in parentheses indicate the number of agencies in each category. For more information on coverage and estimation procedures, see the Nigeria country page on ASTI's website at www.asti.cgiar.org/nigeria/datacoverage.
Figure C4–Distribution of researcher qualifications across various agencies, 2008
Distribution of qualifications across agencies varied widely. Among the NARIs, more than one half of the total researchers at the National Animal Production Research Institute (NAPRI), the Institute for Agricultural Research (IAR), and the Institute of Agriculture Research & Training (IART) were PhD-qualified in 2008. In contrast, BSc holders accounted for more than 40 percent of total research staff at the National Veterinary Research Institute (NVRI), the Nigerian Institute for Oil Palm Research (NIFOR), and the National Stored Products Research Institute (NSPRI). The higher education agencies combined employed a larger share of PhD-qualified researchers (54 percent) compared to the NARIs (combined 28 percent) and the other government agencies (combined 23 percent).
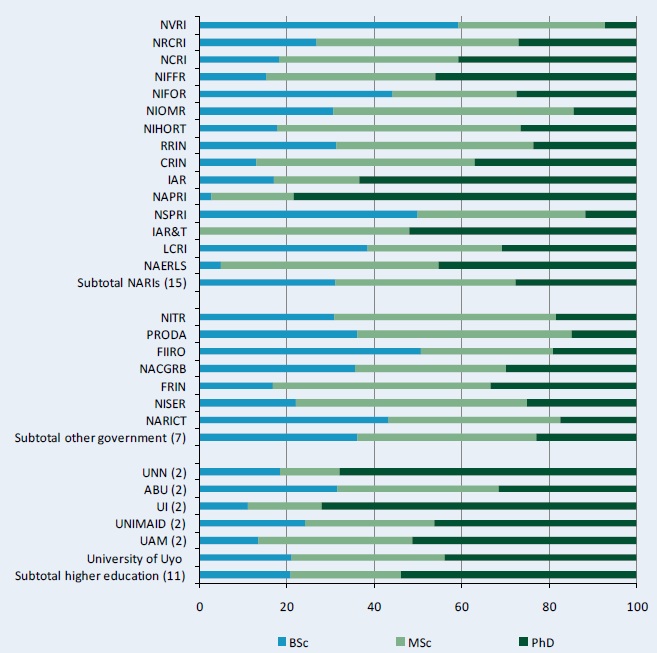
Source: Calculated by authors from ASTI-FIF-ARCN 2009 - 10.
Notes: Figures in parentheses indicate the number of agencies in each category. Staff at higher education agencies do not include estimates. For more information on coverage and estimation procedures, see the Nigeria country page on ASTI's website at www.asti.cgiar.org/nigeria/datacoverage.
Figure C5–Female share of researchers by degree and institutional category, 2000 and 2008
Although the share of female agricultural researchers increased from 18 percent in 2000 to 23 percent in 2008, women remain underrepresented in Nigerian agricultural R&D. In 2008, out of the 1,488 FTE researchers for which gender data were available, only 346 were female. On a positive note, the share of women increased across all qualification levels during this period.
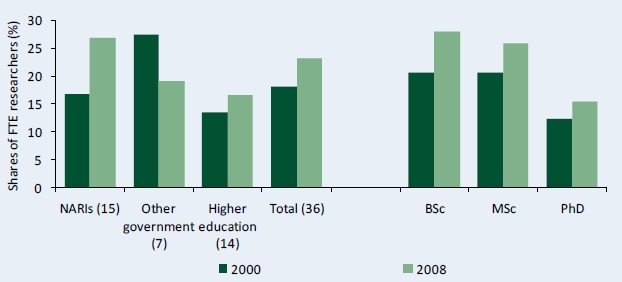
Sources: Calculated by authors from ASTI-FIF-ARCN 2009 - 10 and Beintema and Ayoola 2004.
Notes: Figures in parentheses indicate the number of agencies in each category. Gender data were only available for 14 higher education agencies. For a complete list of agency names, see www.asti.cgiar.org/nigeria/agencies.
Figure C6–Distribution of researcher qualifications by gender, 2000 and 2008
The share of PhD-qualified male researchers increased from 32 to 34 percent during 2000 - 08, whereas the share of PhD-qualified female researchers remained stable at 20 percent.
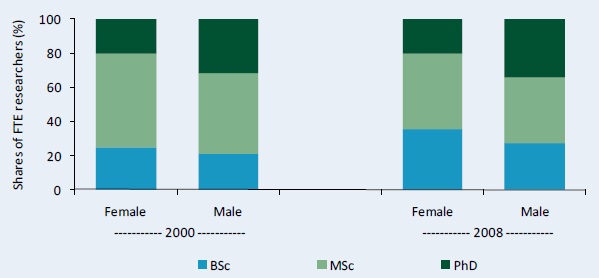
Sources: Calculated by authors from ASTI-FIF-ARCN 2009 - 10 and Beintema and Ayoola 2004.
Note: See Figure C5 for agency sample size.
Figure C7–Female share in total FTE research staff by degree across various agencies, 2008
The National Stored Products Research Institute (NSPRI) employed the highest share of female researchers (55 percent). Among higher education agencies, the Faculty of Agriculture at the University of Ilorin (FA-UNILORIN) had the highest share of female researchers at 29 percent. The Lake Chad Research Institute (LCRI) had the lowest share of female researchers at 8 percent, and all of them were only BSc qualified.
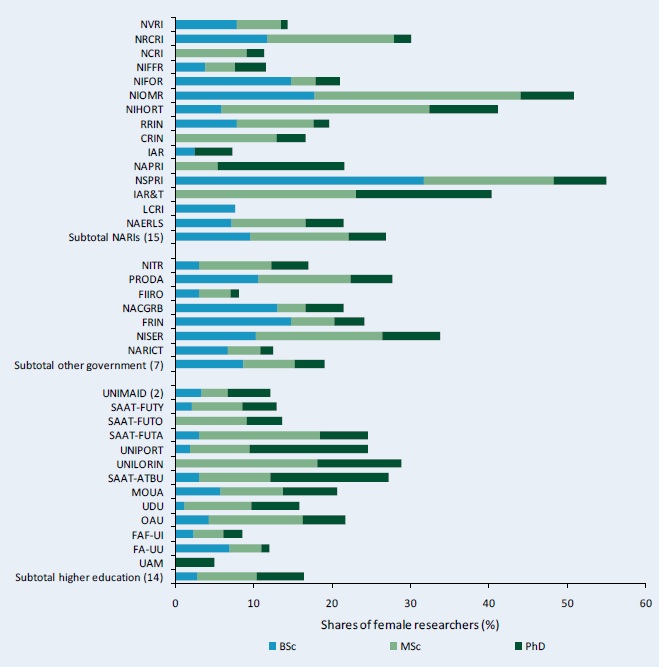
Source: Calculated by authors from ASTI-FIF-ARCN 2009 - 10.
Notes: This figure includesdata from the Faculties of Agriculture at University of Port Harcourt (UNIPORT), University of Ilorin (UNILORIN), and Obafemi Awolowo Univeristy (OAU) in addition to the Faculty of Veterinary Medicine at the Usmanu Danfodiyo University (UDU) and the College of Agronomy at the University of Agriculture, Makurdi (UAM). For a complete listing of universities and faculties, please visit the Nigeria Country Profile at asti.cgiar.org/nigeria/directory.
Figure C8–Age distribution of researchers by gender, 2007
In 2007, 62 percent of researchers were over 40 years old, 28 percent of which were older than 50. Male researchers were slightly older than their female colleagues. In 2007, 66 percent of the male researchers compared with only 52 percent of the female researchers were over the age of 40. Notably, only 6 percent of researchers in our sample were under the age of 31.
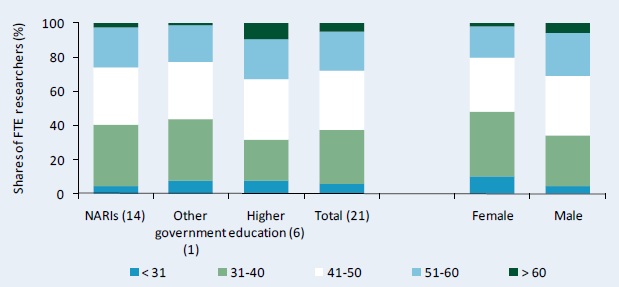
Source: Calculated by authors from ASTI - AWARD 2008/09.
Note: Data for LCRI were not available.
Figure C9–Trends in full-time equivalent researchers and technicians at government agencies, 2001 - 08
Government agricultural R&D agencies employ a large number of technicians with university degrees who do not have official researcher status. In 2008, these agencies employed 8 FTE technicians with PhD degrees, 30 with MSc degrees, and 306 with BSc degrees. From 2001 to 2008, the number of FTE technicians with degrees grew at a slightly slower rate as total FTE researchers in the government sector.
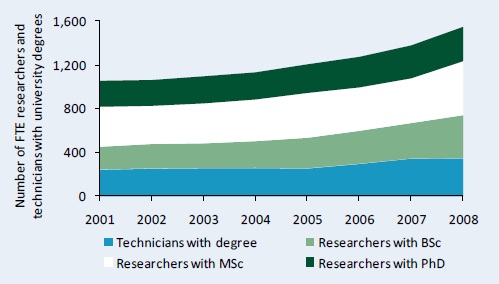
Source: Calculated by authors from ASTI-FIF-ARCN 2009 - 10.
Figure C10–Trends in full-time equivalent researchers and technicians at government agencies, 2001 - 08
The total number of support staff increased slightly during 2001 - 08 from 7,270 to 7,307. In 2008, the government agencies combined employed 345 technicians with BSc or MSc degrees, 2,534 other technicians, 1,588 administrative support staff, and 2,840 other support staff such as drivers, laborers, etc.
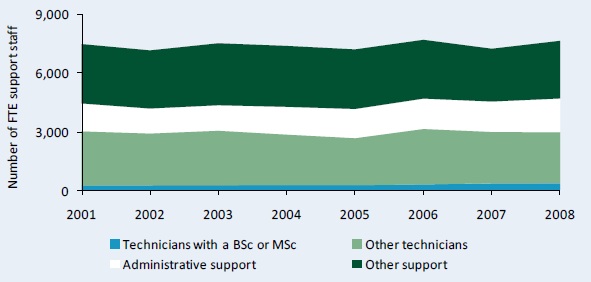
Source: Calculated by authors from ASTI-FIF-ARCN 2009 - 10.
Figure C11–Support-staff-per-researcher ratios by institutional category, 2001 and 2008
On average, the support-staff-per-researcher ratio decreased from 6.3 in 2001 to 4.2 in 2008. The latter ratio comprised 1.6 technicians, 0.9 administrative support staff, and 1.6 other support staff. Compared with the government agencies, ratios in the higher education sector were lower, averaging less than one supporting staff member for every researcher–a common phenomenon across countries, given that research is a secondary activity at the higher education agencies.
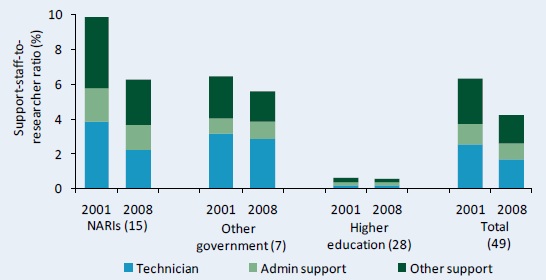
Source: Calculated by authors from ASTI-FIF-ARCN 2009 - 10.
Notes: Figures in parentheses indicate the number of agencies in each category. For more information on coverage and estimation procedures, see the Nigeria country page on ASTI's website at asti.cgiar.org/nigeria/datacoverage.
Copyright (C) 2011 International Food Policy Research Institute, Farm and Infrastructure Foundation, and Agricultural Research Council of Nigeria. Sections of this Data in Focus sheet may be reproduced without the express permission of, but with acknowledgement to, IFPRI, FIF, and ARCN. The Data in Focus sheet has been prepared as an output for the ASTI initiative and has not been peer reviewed. Any opinions stated herein are those of ASTI and do not necessarily reflect the policies and opinions of IFPRI, FIF, or ARCN.