The ASTI Data in Focus series provides additional background data in support of the 2010 Country Note on Nigeria (asti.cgiar.org/pdf/Nigeria-Note.pdf) prepared by the Agricultural Science and Technology Indicators (ASTI) initiative, the Farm and Infrastructure Foundation (FIF), and the Agricultural Research Council of Nigeria (ARCN). Based on data collected by ASTI, FIF, and ARCN, these two outputs review major investment and capacity trends in Nigerian public agricultural research and development (R&D) since 1971, providing important updates on agricultural R&D trends prepared by ASTI in 2001 - 03.
B. Financial resources
This section provides detailed quantitative information on agricultural research expenditures and sources of funding in the government sector in Nigeria for the period 2001 - 08. Supplementary sections present detailed data on long-term trends (Section A), human resources (Section C), and research allocation (Section D). Other supporting information provides macroeconomic trends, a list of agencies included in the study, data sources and estimation procedures, and ASTI's methodology.
Table B1–Total spending levels in million 2005 Nigerian naira at various agencies, 2008
In 2008, the National Veterinary Research Institute (NVRI) accounted for the largest share of expenditures of any single agency, at 2.0 billion 2005 Nigerian nairas. The National Root Crops Research Institute (NRCRI), the National Cereals Research Institute (NCRI), the National Institute for Freshwater Fisheries Research (NIFFR), and the Nigerian Institute for Oil Palm Research (NIFOR) followed, reporting expenditures of 1.2 billion 2005 nairas each. The National Institute for Trypanosomiasis Research (NITR) and the Projects Development Institute (PRODA) are the two largest agencies in the other government category, reporting expenditures of 0.9 and 0.8 billion 2005 nairas, respectively.
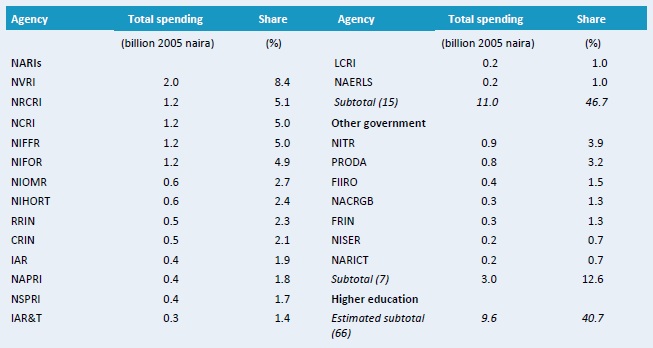
Source: Calculated by authors from ASTI-FIF-ARCN 2009 - 10.
Notes: Figures in parentheses indicate the number of agencies in each category. Expenditures for the 66 higher education agencies were estimated. For more information on coverage and estimation procedures, see the Nigeria country page on ASTI's website at www.asti.cgiar.org/nigeria/datacoverage. For full agency names see www.asti.cgiar.org/nigeria/agencies.
Figure B1–NARI's spending by cost-category adjusted for inflation, 2001 - 08
From 2001 to 2008, spending on salaries decreased in both absolute and relative terms at the 15 National Agricultural Research Institute (NARIs). In 2001, salaries accounted for more than 60 percent of spending compared to 43 percent in 2008. This was the direct result of increased capital investments on new facilities and rehabilitation of old facilities as well as higher operating costs.
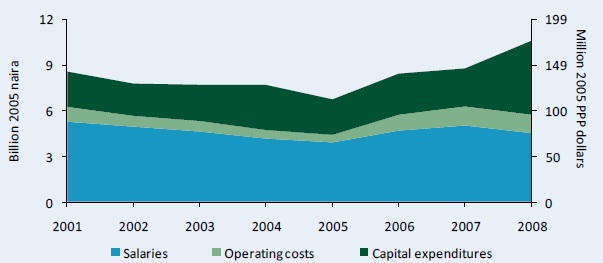
Source: Calculated by authors from ASTI-FIF-ARCN 2009 - 10.
Notes: Salaries exclude those of expatriate staff. For more information on coverage and estimation procedures, see the Nigeria country page on ASTI's website at www.asti.cgiar.org/nigeria/datacoverage.
Figure B2–Other government agencies' spending by cost-category adjusted for inflation, 2001 - 08
The share of salaries in total spending at the seven other government agencies also declined during 2001 - 08, but at a lesser extent. In 2008 the salary share was 51 percent compared to 60 percent in 2001. This was also the direct result of increased capital investment costs.
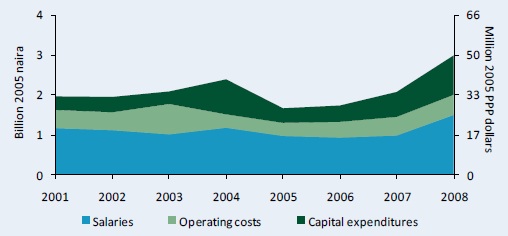
Source: Calculated by authors from ASTI-FIF-ARCN 2009 - 10.
Notes Salaries exclude those of expatriate staff.
Figure B3–Distribution of spending by cost category across government agencies, 2008
The allocation of funds for salaries, operating and program costs, and capital investments varied widely across agencies. In 2008, the Forestry Research Institute of Nigeria (FRIN) spent the largest portion of its budget on salaries, at 93 percent, although this was an increase over the average of 73 percent in prior years. In contrast, capital investments accounted for 75 percent of the Projects Development Institute's (PRODA) total spending. NIFFR and NCRI also spent large shares on capital at 69 percent and 68 percent, respectively.
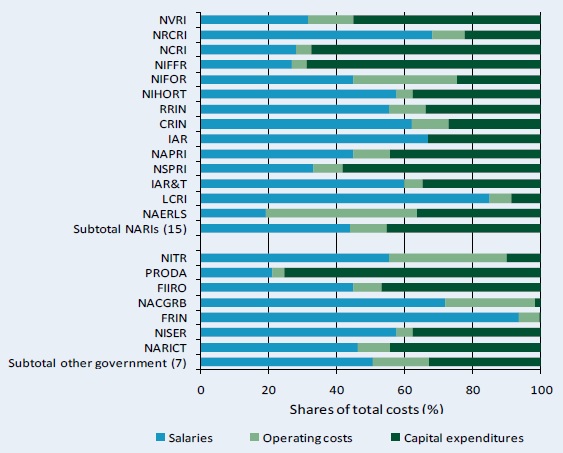
Source: Calculated by authors from ASTI-FIF-ARCN 2009 - 10.
Copyright (C) 2011 International Food Policy Research Institute, Farm and Infrastructure Foundation, and Agricultural Research Council of Nigeria. Sections of this Data in Focus sheet may be reproduced without the express permission of, but with acknowledgement to, IFPRI, FIF, and ARCN. The Data in Focus sheet has been prepared as an output for the ASTI initiative and has not been peer reviewed. Any opinions stated herein are those of ASTI and do not necessarily reflect the policies and opinions of IFPRI, FIF, or ARCN.