The ASTI Data in Focus series provides additional background data in support of the 2010 Country Note on Nigeria (asti.cgiar.org/pdf/Nigeria-Note.pdf) prepared by the Agricultural Science and Technology Indicators (ASTI) initiative, the Farm and Infrastructure Foundation (FIF), and the Agricultural Research Council of Nigeria (ARCN). Based on data collected by ASTI, FIF, and ARCN, these two outputs review major investment and capacity trends in Nigerian public agricultural research and development (R&D) since 1971, providing important updates on agricultural R&D trends prepared by ASTI in 2001 - 03.
Long-Term Trends
This section provides detailed quantitative information on long-term investment and capacity trends in Nigerian public agricultural R&D for the period 1971 - 2008. Subsequent sections present detailed data on financial resources (Section B), human resources (Section C), and research allocation (Section D). Other supporting information provides macroeconomic trends, a list of agencies included in the study, data sources and estimation procedures, and ASTI's methodology.
Figure A1–Public agricultural R&D spending adjusted for inflation, 1971 - 2008
Public spending on agricultural research and development (R&D) in Nigeria varied considerably over the period 1971 - 2008. During the 1970s, expenditures were generally higher than in the following two decades. The early 1980s saw a sharp decline and agricultural R&D spending remained low until the mid - 1990s. In 1997, expenditures began to grow dramatically as a result of increased salary levels of government and university staff combined with increasing government contributions to agricultural research. In 2008, Nigeria spent 23.6 billion naira or 391.8 million PPP dollars (in 2005 prices).
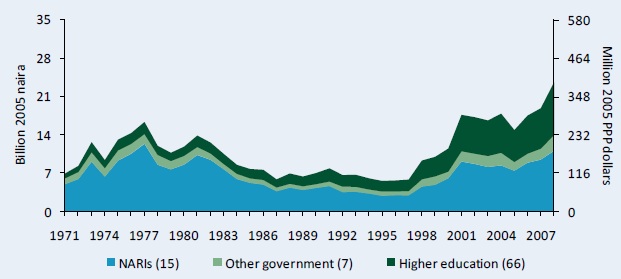
Sources: Calculated by authors from ASTI-FIF-ARCN 2009 - 10 and Beintema and Ayoola 2004.
Notes: Figures in parentheses indicate the number of agencies in each category. For more information on coverage and estimation procedures, see the Nigeria country page on ASTI's website at asti.cgiar.org/nigeria.
Figure A2–Public agricultural R&D spending in current Nigerian naira, 1991 - 2008
Public agricultural R&D spending increased rapidly when expressed in current prices. Fluctuations were less pronounced than in inflation-adjusted prices (see Figure A1).
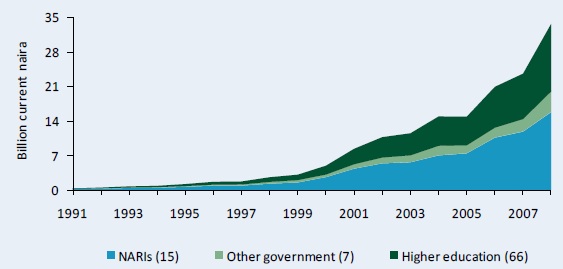
Sources: Calculated by authors from ASTI-FIF-ARCN 2009 - 10 and Beintema and Ayoola 2004.
Notes: Figures in parentheses indicate the number of agencies in each category. For more information on coverage and estimation procedures, see the Nigeria country page on ASTI's website at asti.cgiar.org/nigeria.
Table A1–Public agricultural research spending, 1971 - 2008
Total spending on public agricultural R&D during 2006 - 08 averaged 20.0 billion naira or 332.3 million PPP dollars per year, well above the levels recorded in the 1970s and 1980s. During 1991 - 95, spending was three times lower than during 2006 - 08.
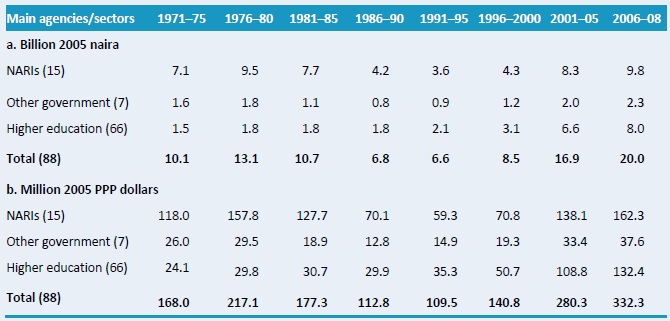
Sources: Calculated by authors from ASTI-FIF-ARCN 2009 - 10 and Beintema and Ayoola 2004.
Notes: Figures in parentheses indicate the number of agencies in each category. Expenditures for the 66 higher education agencies were estimated. Calculations are based on five-year averages, with the exception of 2006 - 08–a three-year average.
Figure A3–Shares of agricultural R&D spending by institutional category, 1971 - 2008
During 2006 - 08, the 15 National Agricultural Research Institutes (NARIs) combined accounted for 49 percent of Nigeria's total agricultural R&D spending, compared with 70 percent in the early 1970s. This decline was the result of relatively higher increases in expenditures at other government and higher education agencies. The higher education sector's spending share increased from 14 percent in the early 1970s to 40 percent in 2006 - 08.
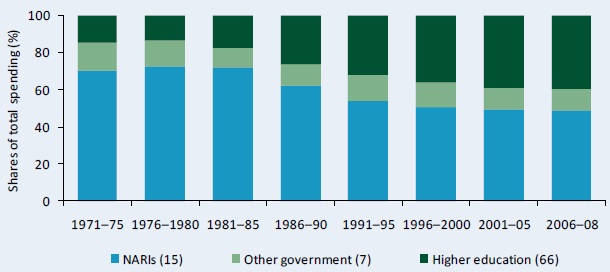
Sources: Calculated by authors from ASTI-FIF-ARCN 2009 - 10 and Beintema and Ayoola 2004.
Notes: Figures in parentheses indicate the number of agencies in each category. Calculations are based on five-year averages, with the exception of 2006 - 08–a three-year average.
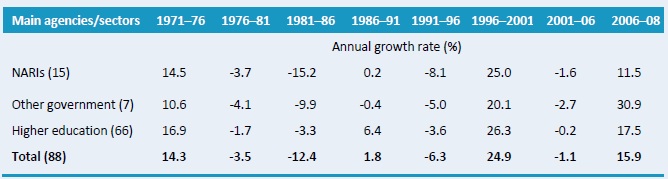
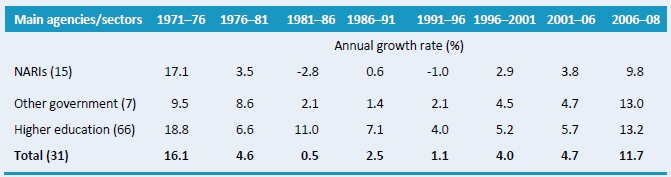
Table A2–Annual rates of R&D spending growth by institutional category, 1971 - 2008
Annual growth rates of agricultural R&D spending fluctuated by year and across agency groupings in line with absolute expenditure trends (see Figure A1). After a period of strong growth during 1971 - 76, yearly growth sharply dropped, stagnated, or was negative until the late-90s. During 1996 - 2001, the annual growth rate reached 25 percent followed by another period of stagnation before benefitting from a high growth rate of 16 percent during 2006 - 08. During this period, the NARIs experienced a combined annual growth rate of 12 percent compared with a combined growth rate of 31 percent for the other government agencies. However, large variations were reported across the various government and higher education agencies.
Sources: Calculated by authors from ASTI-FIF-ARCN 2009 - 10 and Beintema and Ayoola 2004.
Notes: Figures in parentheses indicate the number of agencies in each category. Expenditures for the 66 higher education agencies were estimated. Annual growth rates were calculated using the least-squares regression method. See asti.cgiar.org/nigeria for more information.
.
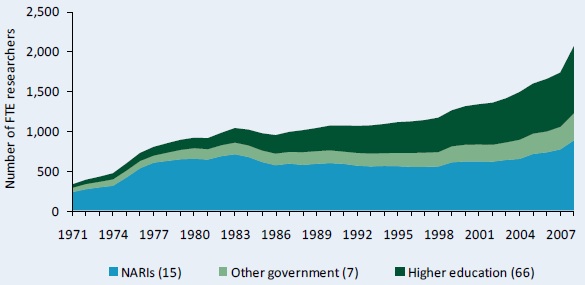
Figure A4–Public agricultural research staff in full-time equivalents, 1971 - 2008
The total number of agricultural researchers employed in Nigeria more than quadrupled from 337 full-time equivalent (FTE) researchers in 1971 to 2,062 FTEs in 2008. The majority of this increase took place in the higher education sector.
Source: Calculated by authors from ASTI-FIF-ARCN 2009 - 10 and Beintema and Ayoola 2004.
Note: Figures in parentheses indicate the number of agencies in each category.
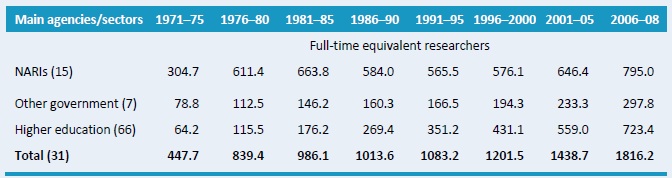
Table A3–Public agricultural research staffing in full-time equivalents, 1971 - 2008
Disaggregated data illustrate that Nigeria's research capacity has been strengthened over time. Total researcher numbers increased from an average 448 FTEs in the early 1970s to 1,816 FTEs during 2006 - 08.
Sources: Calculated by authors from ASTI-FIF-ARCN 2009 - 10 and Beintema and Ayoola 2004.
Notes: Figures in parentheses indicate the number of agencies in each category. Calculations are based on five-year averages, with the exception of 2006 - 08–a three-year average.
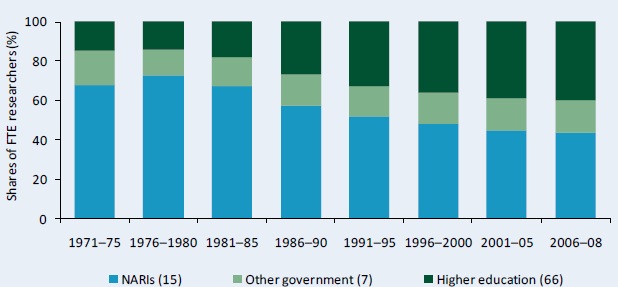
Figure A5–Shares of public agricultural R&D staff numbers by institutional category, 1971 - 2008
Due to the increased role of other government and higher education agencies in Nigerian agricultural R&D over time, the NARIs' share in total research staffing (in FTEs) declined from an average of 68 percent during 1971 - 75 to 44 percent during 2006 - 08. During the latter period the higher education agencies accounted for 40 percent of researchers, and other government agencies accounted for the remaining 16 percent.
Sources: Calculated by authors from ASTI-FIF-ARCN 2009 - 10 and Beintema and Ayoola 2004.
Notes: Figures in parentheses indicate the number of agencies in each category. Calculations are based on five-year averages, with the exception of 2006 - 08–a three-year average.
Table A4–Annual rates of growth in R&D staff numbers by institutional category, 1971 - 2008
Overall, the average rate of growth of agricultural R&D staff was positive throughout the entire period. The total number of researchers grew by 5 percent per year during 2001 - 06 and 12 percent per year during 2006 - 08. During the latter period, the National Stored Products Research Institute (NSPRI) experienced the highest growth rate of 39 percent per year.
Sources: Calculated by authors from ASTI-FIF-ARCN 2009 - 10 and Beintema and Ayoola 2004.
Notes: Figures in parentheses indicate the number of agencies in each category. Annual growth rates were calculated using the least-squares regression method.
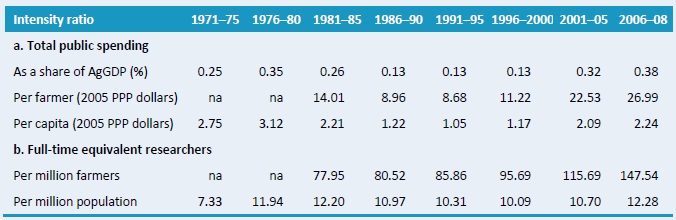
Table A5–Various agricultural research intensity ratios, 1971 - 2008
Total public spending on agricultural research as a percentage of agricultural output (AgGDP)–known as the research intensity ratio–followed the spending trends described in Figure A1 and Table A2. The agricultural intensity ratio sharply declined during the 1980s before peaking during 2006-08 at an average of $0.38 for every $100 of agricultural output. The average number of FTE researchers per million farmers and per million population steadily grew over the entire period.
Sources: Calculated by authors from ASTI-FIF-ARCN 2009 - 10; Beintema and Ayoola 2004; FAO 2009; World Bank 2010.
Notes: Calculations are based on five-year averages, with the exception of 2006 - 08–a three-year average. Research spending as a share of AgGDP is calculated using a weighted average. Farmers are defined as population economically active in agriculture, an FAO classification. Pre-1980 data on farmer number were not available.
Copyright (C) 2011 International Food Policy Research Institute, Farm and Infrastructure Foundation, and Agricultural Research Council of Nigeria . Sections of this Data in Focus sheet may be reproduced without the express permission of, but with acknowledgement to, IFPRI, FIF, and ARCN. The Data in Focus sheet has been prepared as an output for the ASTI initiative and has not been peer reviewed. Any opinions stated herein are those of ASTI and do not necessarily reflect the policies and opinions of IFPRI, FIF, or ARCN.