The ASTI Data in Focus series provides additional background data in support of the 2010 Country Note on Mali (asti.cgiar.org/pdf/Mali-Note.pdf) prepared by the Agricultural Science and Technology Indicators (ASTI) initiative and the Rural Economy Institute (IER). Based on data collected by ASTI and IER, these two outputs review major investment and capacity trends in Mali's public agricultural research and development (R&D) since 1981, providing important updates on agricultural R&D trends prepared by ASTI and IER in 2003–04.
C. Human Resources
This section provides detailed quantitative information on full–time equivalent (FTE) agricultural research and support staff trends, including qualifications, gender and age distribution, and support–staff–per–researcher ratios. Complementary sections of this issue on Mali present detailed data on long–term trends (Section A), financial resources (Section B) and research allocation (Section D). Other supporting information provides macroeconomic trends, a list of agencies included in the study, data sources and estimation procedures, and ASTI's methodology.
Table C1–Total research staff levels across various agencies, 2008
In 2008, the Rural Economy Institute (IER) accounted for more than 80 of percent of the full–time equivalent (FTE) research capacity in Mali, with 257 FTEs. The Rural Polytechnic Institute for Training and Applied Research (IPR–IFRA) had the second highest number of researchers ( 42 FTEs) accounting for 14 percent of the country's R&D research capacity. In 2008, there were a total of 313 FTE researchers in Mali.
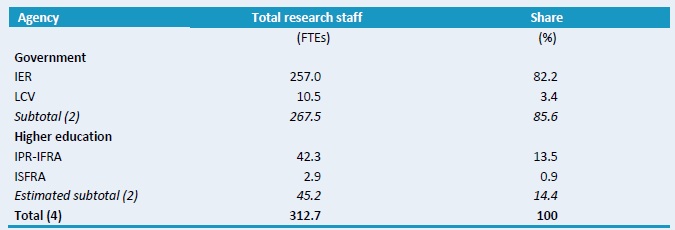
Source: Calculated by authors from ASTI–IER 2009–10.
Note: For more information on coverage and estimation procedures, see http://asti.cgiar.org/mali/datacoverage.
Figure C1–Full–time equivalent researcher trends at IER by degree, 2001–08
The number of PhD–qualified FTE researchers at IER increased during 2001–08 from 41 to 61, while the number of MSc–qualified researchers remained fairly stable. IER did not employ any BSc–level researchers during this period. In addition to these state–employed researchers ("fonctionnaires"), there was a large number of contract researchers ("contractuels") for which degree data were not available.
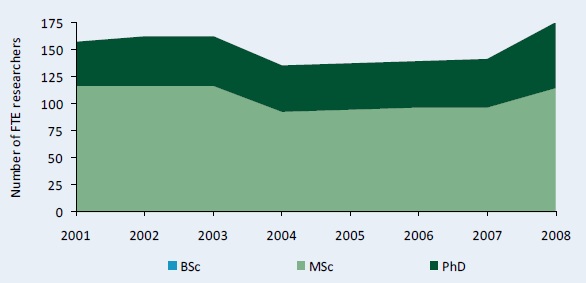
Sources: Calculated by authors from ASTI–IER 2009–10.
Figure C2–Full–time equivalent researcher trends at IPR–IFRA and ISFRA by degree, 2001–08
FTE research capacity at IPR–IFRA and the Higher Institute of Training and Applied Research (ISFRA) has risen from 31 FTE researchers in 2001 to 45 in 2009. Most of this increase occurred from 2001 to 2002 when IPR–IFRA hired 7 BSc–qualified researchers.
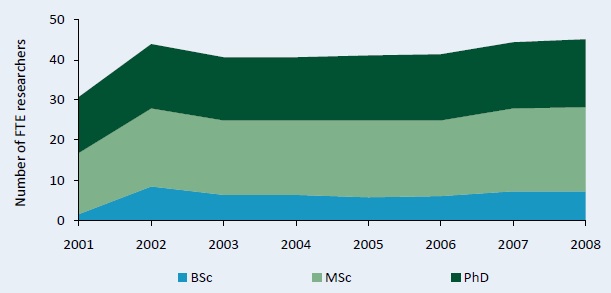
Sources: Calculated by authors from ASTI–IER 2009–10.
Note: For a complete list of the agencies included in our sample, see asti.cgiar.org/mali/agencies.
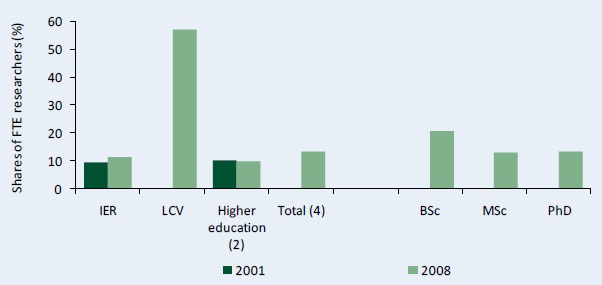
Figure C3–Distribution of researcher qualifications across various agencies, 2008
The two higher education agencies and the Central Veterinary Laboratory (LCV) had the highest share of FTE researchers with PhD degrees (38 percent). In 2008, 35 percent of FTE researchers at IER held PhD degrees and 65 percent held MSc degrees.
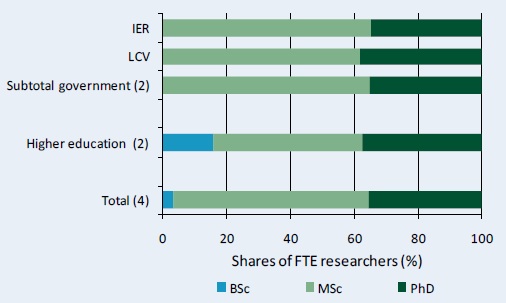
Source: Calculated by authors from ASTI–IER 2009–10.
Figure C4–Share of female researchers by degree and institutional category, 2001 and 2008
In 2008, 13 percent of Mali's agricultural researchers were female. At LCV, the proportion of female researchers was much larger than at IER and the two higher–education agencies. At IER, women are especially underrepresented, with the exception of the Food Technology Laboratory where women (one of whom is the director) form the majority. The share of female researchers increased at IER from 2001 to 2008.
Source: Calculated by authors from ASTI–IER 2009–10 and Stads and Kouriba 2004
Notes: Figures in parentheses indicate the number of agencies in each category. 2001 gender data for LCV were unavailable. A complete list of the agencies included in the sample, see asti.cgiar.org/mali/agencies.
Figure C5–Distribution of researcher qualifications by gender, 2001 and 2008
This figure illustrates the relative levels of researcher qualifications at IER and higher education agencies by gender in 2001 and 2008. The share of female PhD–qualified staff and BSc–qualified staff increased during this period from 28 to 42 percent and 0 to 6 percent, respectively.
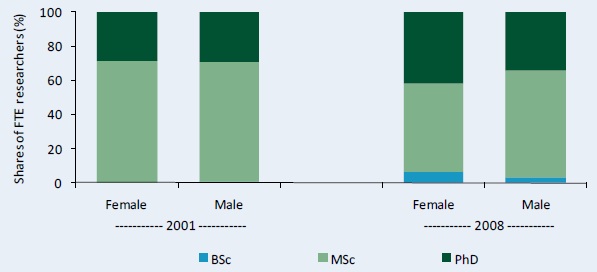
Sources: Calculated by authors from ASTI–IER 2009–10 and Stads and Kouriba 2004.
Notes: Figures in parentheses indicate the number of agencies in each category. 2001 gender data for LCV were unavailable. A complete list of the agencies included in the sample, see asti.cgiar.org/mali/agencies.
Figure C6–Trends in full–time equivalent support staff at IER, 2001–08
The overall number of support staff at IER–including, technicians, administrative staff, and other support staff–increased from 456 FTEs in 2001 to 621 FTEs in 2008. This increase mainly took place from 2007 to 2008 when the number of MSc–qualified technicians at IER increased from 97 to 152 FTEs.
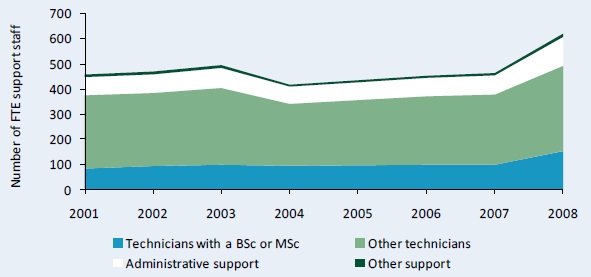
Source: Calculated by authors from ASTI–IER 2009–10.
Note: Support staff data were not available at any of the other agencies during this period.
Figure C7–Support–staff–per–researcher ratio at IER, 2001 and 2008
The support–staff–per–researcher at IER ratio slightly increased from 2.2 in 2001 to 2.4 in 2008. In 2008, for every agricultural researcher, IER employed 1.9 technicians, 0.4 administrative staff, and 0.1 other support staff.
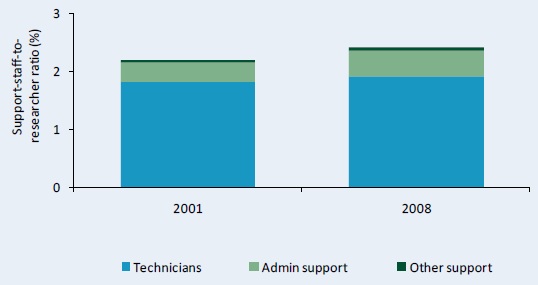
Source: Calculated by authors from ASTI–IER 2009–10.
Notes: For more information on coverage and estimation procedures, see the Mali country page on ASTI's website at asti.cgiar.org/mali/datacoverage.
Copyright (C) 2011 International Food Policy Research Institute and Rural Economy Institute. Sections of this Data in Focus issue may be reproduced without the express permission of, but with acknowledgement to IFPRI and IER. This series is an output of the ASTI initiative and has not been peer reviewed. Any opinions stated herein are those of ASTI and do not necessarily reflect the policies and opinions of IFPRI or IER.