The ASTI Data in Focus series provides additional background data in support of the 2010 Country Note on Mali (asti.cgiar.org/pdf/Mali-Note.pdf) prepared by the Agricultural Science and Technology Indicators (ASTI) initiative and the Rural Economy Institute (IER). Based on data collected by ASTI and IER, these two outputs review major investment and capacity trends in Mali's public agricultural research and development (R&D) since 1981, providing important updates on agricultural R&D trends prepared by ASTI and IER in 2003–04.
B. Financial Resources
This section provides detailed quantitative information on expenditures in Mali's public agricultural R&D for the period 1991–2008. Complementary sections present detailed data on long–term trends (Section A), human resources (Section C), and research allocation (Section D). Other supporting information provides macroeconomic trends, a list of agencies included in the study, data sources and estimation procedures, and ASTI's methodology.
Table B1–Total spending levels in billion 2005 CFA francs across various agencies, 2008
In 2008, the Rural Economy Institute (IER) accounted for over three–quarters of Mali's agricultural research and development (R&D) expenditures spending 18.9 billion 2005 CFA francs. The only other government agency, the Central Veterinary Laboratory (LCV), accounted for 9 percent of total spending, or 2.2 billion CFA francs. Combined, the higher education sector spent 3.6 billion CFA francs and accounted for 14 percent of total expenditures.
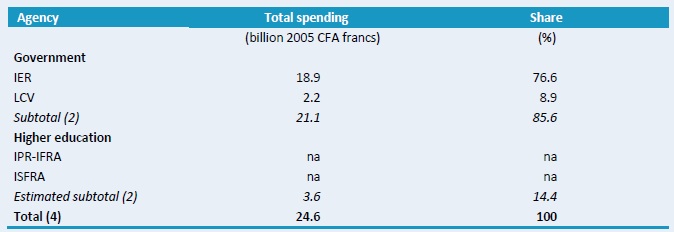
Source: Calculated by authors from ASTI–IER 2009–10.
Notes: Figures in parentheses indicate the number of agencies in each category. For more information on coverage and estimation procedures, see asti.cgiar.org/mali/datacoverage.
Figure B1–IER and LCV's spending by cost category, adjusted for inflation, 2005–08
Given that contract staff is not on IER's payroll and that their salaries are paid out of the institute's operating budget, it was very difficult to make a distinction between salary spending and operating costs. Salaries, operating, and program costs have therefore been lumped together. During 2005–08, IER allocated 86 percent of its budget to staff salaries, operating, and program costs, and 14 percent to capital investments. Over the past few years, IER has invested considerable sums of money in planning and laying out plots of agricultural land, in building laboratories, and rehabilitating some of its research infrastructure. During the same period, LCV allotted 26 percent of its budget to salary costs, with operating costs accounting for 59 percent and capital investments for 16 percent.
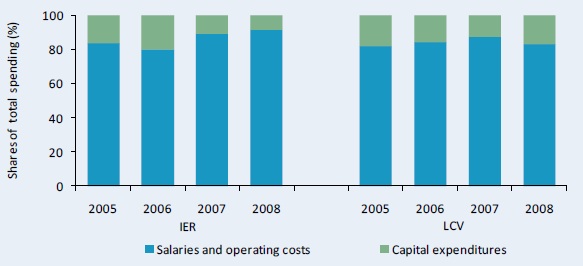
Figure B2–IER's funding sources adjusted for inflation, 2004–08
IER derives its funding from three primary sources: the national government; donors and development banks; and internally–generated resources. During 2004–08, the share of funding received from the national government increased from 28 to 44 percent. In contrast, donor contributions as a share of IER's funding fell from 60 to 53 percent. IER also received funds through the sale of seeds and delivery of services. However, revenue received from these activities only accounted for 3 percent of IER's funding in 2008.
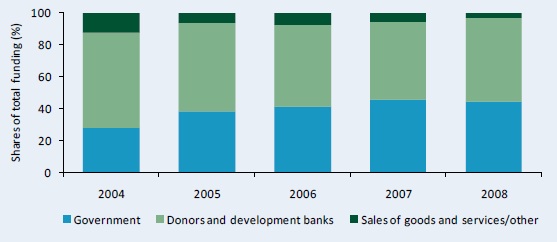
Source: Calculated by authors from ASTI–IER 2009–10.
Copyright (C) 2011 International Food Policy Research Institute and Rural Economy Institute. Sections of this Data in Focus issue may be reproduced without the express permission of, but with acknowledgement to IFPRI and IER. This series is an output of the ASTI initiative and has not been peer reviewed. Any opinions stated herein are those of ASTI and do not necessarily reflect the policies and opinions of IFPRI or IER.