The ASTI Data in Focus series provides additional background data in support of the 2010 Country Note on Mali asti.cgiar.org/pdf/Mali-Note.pdf) prepared by the Agricultural Science and Technology Indicators (ASTI) initiative and the Rural Economy Institute (IER). Based on data collected by ASTI and IER, these two outputs review major investment and capacity trends in Mali's public agricultural research and development (R&D) since 1981, providing important updates on agricultural R&D trends prepared by ASTI and IER in 2002–04.
A. Long–Term Trends
This section provides detailed quantitative information on long–term investment and capacity trends in Mali's public agricultural R&D for the period 1981–2008. Subsequent sections present detailed data on financial resources (Section B), human resources (Section C), and research allocation (Section D). Other supporting information provides macroeconomic trends, a list of agencies included in the study, data sources and estimation procedures, and ASTI's methodology.
Figure A1–Agricultural R&D spending adjusted for inflation, 1981–2008
Following a period of steady growth that lasted from the mid–1980s to the turn of the millennium, total agricultural research and development (R&D) spending levels in Mali have since exhibited an erratic trend. This erratic trend was driven by unstable levels of donor funding at the Rural Economy Institute (IER). In 2008, R&D investments totaled 5.6 billion CFA francs, or 24.6 million PPP dollars, both in 2005 constant prices.
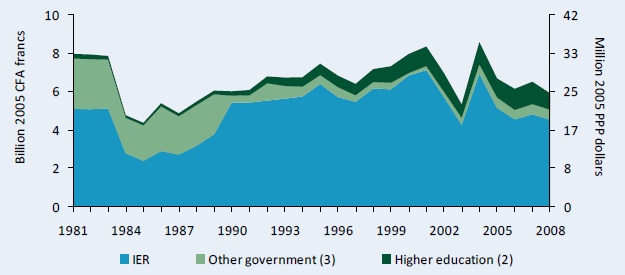
Sources: Calculated by authors from ASTI–IER 2009–10 and Stads and Kouriba 2004.
Notes: Figures in parentheses indicate the number agencies in each category. "Other government (3)" includes the National Institute of Zootechnic, Forestry, and Hydrobiological Research (INRZFH) and the Agricultural Mechanization Division (DMA), which merged with IER in 1990 and 2001, respectively. For more information on coverage and estimation procedures, see the Mali country page on ASTI's website at asti.cgiar.org/mali.
Figure A2–Agricultural R&D spending in current CFA francs, 1981–2008
In current prices, public agricultural R&D spending showed a steady increase during the 1981–2008, but it has not kept pace with national inflation rates (see Figure A1).
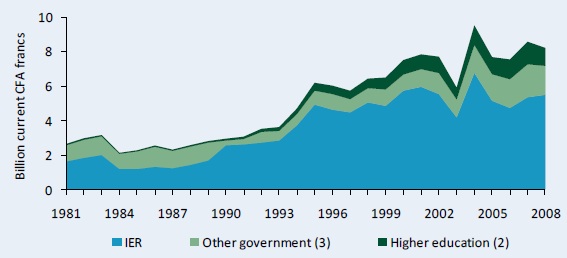
Sources: Calculated by authors from ASTI–IER 2009–10 and Stads and Kouriba 2004.
Note: Figures in parentheses indicate the number of agencies in each category.
Table A1–Agricultural research spending, 1971–2008
The underlying data show that agricultural R&D spending at higher education agencies has been steadily increasing from an average of 0.2 billion CFA francs or 0.8 million PPP dollars in the early 1980s, to 1.0 billion CFA francs or 4.3 million PPP dollars during 2006–08. IER and the other government agencies experienced much more erratic trends. Spending at IER peaked in the late 1990s at an average of 6.1 billion CFA francs or 25.2 million PPP dollars and declined thereafter reaching 4.6 billion CFA francs or 19.3 million PPP dollars during 2006–08. In contrast, agricultural R&D spending slightly increased at the other government agencies after the turn of the millennium reaching an average of 0.5 billion CFA francs or 2.2 million PPP dollars during 2006–08.
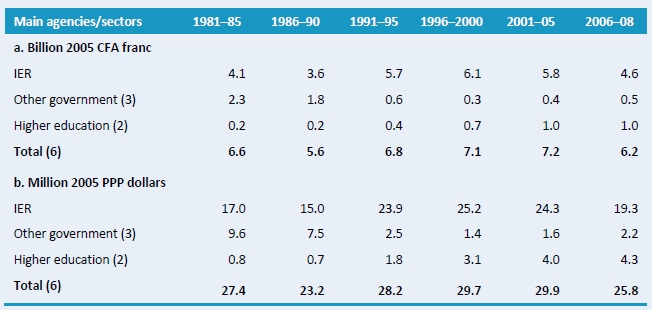
Sources: Calculated by authors from ASTI–IER 2009–10 and Stads and Kouriba 2004.
Notes: Figures in parentheses indicate the number of agencies in each category.
Figure A3–Shares of agricultural R&D spending by institutional category, 1981–2008
As absolute levels of agricultural R&D spending increased at IER during the 1980s and 1990s, so did IER's relative share of total agricultural R&D expenditures. During the late 1990s, IER accounted for 85 percent of total agricultural R&D expenditures in Mali while other government agencies and higher education agencies accounted for 5 and 10 percent, respectively. However, IER's share of total agricultural R&D expenditures decreased after the turn of the millennium. During 2005–08, IER accounted for 75 percent, the higher education agencies accounted for 17 percent, and other government agencies accounted 9 percent total agricultural R&D expenditures.
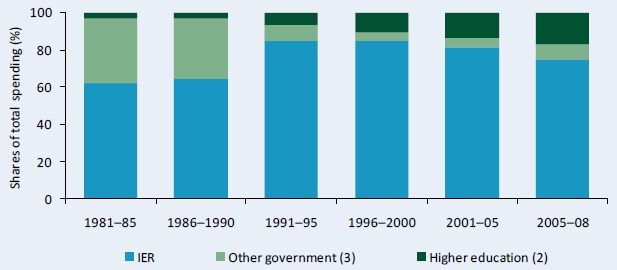
Sources: Calculated by authors from ASTI–IER 2009–10 and Stads and Kouriba 2004.
Notes: Figures in parentheses indicate the number of agencies in each category. Shares are based on five–year averages with the exception of 2005–08, a three–year average.
Table A2–Annual rates of R&D spending growth by institutional category, 1981–2008
The annual rate of growth in public agricultural R&D spending in Mali was negative in the early 1980s before becoming positive through the late 1980s and 1990s. The National Institute of Zootechnic, Forestry, and Hydrobiological Research (INRZFH) and the Agricultural Mechanization Division (DMA) merged with IER in 1990 and 2001 leading to a declining annual growth rate in the other government category. Central Veterinary Laboratory (LCV), the only remaining other government agency, had a strong growth rate of more than 20 percent during 2001–06 and 3 percent during 2006–08. However, LCV's positive growth rate was more than off–set by negative growth rates at IER and the higher education agencies during 2006–08 when the annual growth rate reached –2 percent.
Sources: Calculated by authors from ASTI–IER 2009–10 and Stads and Kouriba 2004.
Notes: Figures in parentheses indicate the number of agencies in each category. Annual growth rates were calculated using the least squares regression method. Expenditures at the higher education agencies were estimated. For more information, see asti.cgiar.org/mali/datacoverage.
Figure A4–Agricultural research staffing in full–time equivalents, 1981–2008
Mali's total agricultural research capacity levels also present an irregular trend. Since the turn of the millennium, important annual variations have been recorded which are largely due to alternating waves of hiring and laying–off staff at IER. In 2008, Mali employed a total of 313 researchers expressed in full–time equivalents (FTEs).
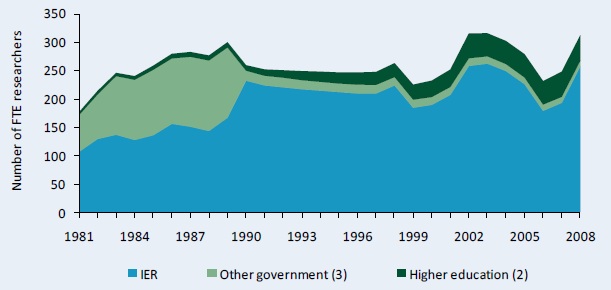
Sources: Calculated by authors from ASTI–IER 2009–10 and Stads and Kouriba 2004.
Notes: Figures in parentheses indicate the number of agencies in each category. For more information on coverage and estimation procedures, see asti.cgiar.org/mali/datacoverage
Table A3–Agricultural research staffing in full–time equivalents, 1981–2008
Disaggregated data illustrate the fluctuations of human resource capacity in Mali's agricultural R&D system over time. Research capacity at IER steadily rose from 127 FTEs in the early 1980s reaching an average of 240 FTEs during 2001–05 and falling sharply thereafter. As a result of the aforementioned mergers of two of the other government agencies into IER, research capacity at other government agencies sharply dropped in the early 1990s. Research capacity at the higher education agencies increased from 6 FTE in the early 1980s to 44 during 2006–08.
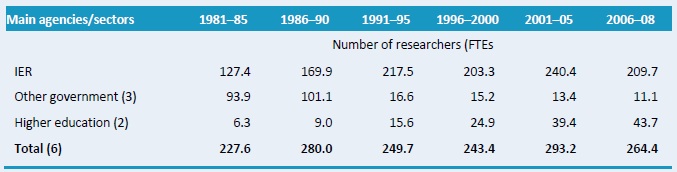
Sources: Calculated by authors from ASTI–IER 2009–10 and Stads and Kouriba 2004.
Notes: Figures in parentheses indicate the number of agencies in each category. Calculations are based on five–year averages with the exception of 2006–08, a three–year average.
Figure A5–Shares of agricultural R&D staffing by institutional category, 1981–2008
The distribution of agricultural research staff changed during 1981–2008. During the 1980s, IER accounted for more than 60 percent of agricultural R&D capacity in Mali. However, as a result of the merger of two other government agencies with IER, the institute's share climbed to more than 80 percent during the 1990s before falling to 75 percent during 2005–08. The higher education agencies' share of agricultural R&D capacity increased from 3 percent in the early 1980s to 17 percent during 2005–08.
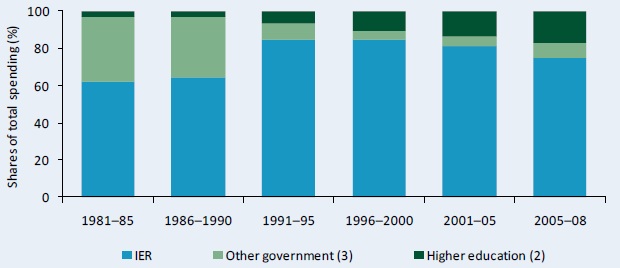
Sources: Calculated by authors from ASTI–IER 2009–10 and Stads and Kouriba 2004.
Note: Figures in parentheses indicate the number of agencies in each category.
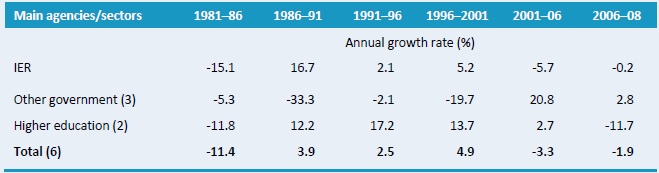
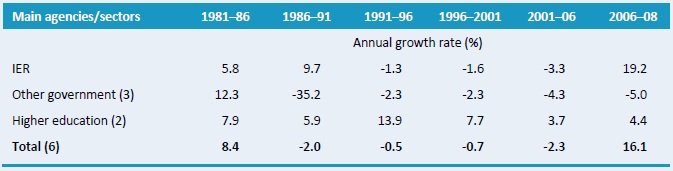
Table A4–Annual rates of growth in R&D staffing by institutional category, 1981–2008
The annual rate of growth in R&D capacity was strong in the early 1980s (8.4 percent) but thereafter became negative. Not until 2006–08 did the annual growth rate of agricultural R&D capacity become positive again reaching 16 percent. This strong growth rate was driven by IER's growth rate of 19 percent.
Sources: Calculated by authors from ASTI–IER 2009–10 and Stads and Kouriba 2004.
Notes: Figures in parentheses indicate the number of agencies in each category. Annual growth rates were calculated using the least squares regression method.
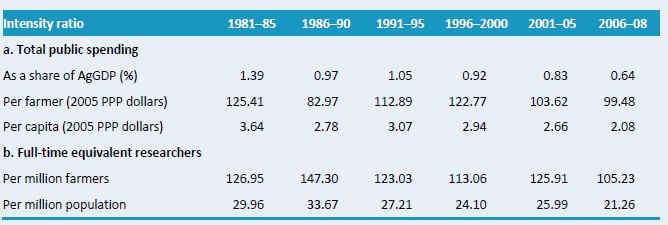
Table A5–Agricultural research intensity ratios, 1981–2008
All agricultural research intensity ratios declined from 1981 to 2008. Research spending as a share of agricultural gross domestic product (AgGDP) fell by 40 percent during this period. During 1981–85, the country spent an average of $1.39 of its AgGDP on agricultural research compared with $0.64 during 2006–08. Additionally, the number of researchers per million farmers fell from 127 FTEs in the early 1980s to 105 in 2006–08.
Sources: Calculated by authors from ASTI–IER 2009–10 and Stads and Kouriba 2004; FAO 2009; and World Bank 2009.
Notes: Calculations are based on five–year averages with the exception of 2005–08, a three–year average. Research spending as a share of AgGDP is calculated using a weighted average. Farmers are defined as the economically active agricultural population (an FAO classification). Pre–1980 data on farmer numbers were unavailable.