The ASTI Data in Focus series provides additional background data in support of the 2010 Country Note on Guinea (asti.cgiar.org/pdf/Guinea-Note.pdf) prepared by the Agricultural Science and Technology Indicators (ASTI) initiative and the Guinean Agricultural Research Institute (IRAG). Based on data collected by ASTI and IRAG, these two outputs review major investment and capacity trends in Guinea's public agricultural research and development (R&D) since 1991, providing important updates on agricultural R&D trends prepared by ASTI and IRAG in 2003–04.
Long-Term Trends
This section provides detailed quantitative information on long-term investment and capacity trends in Guinea's public agricultural R&D for the period 1991–2008. Subsequent sections present detailed data on financial resources (Section B), human resources (Section C), and research allocation (Section D). Other supporting information provides macroeconomic trends, a list of agencies included in the study, data sources and estimation procedures, and ASTI's methodology.
Figure A1–Agricultural R&D spending adjusted for inflation, 1991–2008
Agricultural research and development (R&D) spending in Guinea fell by more than 70 percent during 1991–2008. In 1991, Guinea invested 13.0 billion CFA francs or 11.6 million PPP dollars compared with 3.4 billion CFA francs or 3.2 million PPP dollars (in 2005 prices). This dramatic decrease in total expenditures was mostly the result of falling expenditures at the Guinean Agricultural Research Institute (IRAG) as a result of the conclusion of large donor-funded projects.
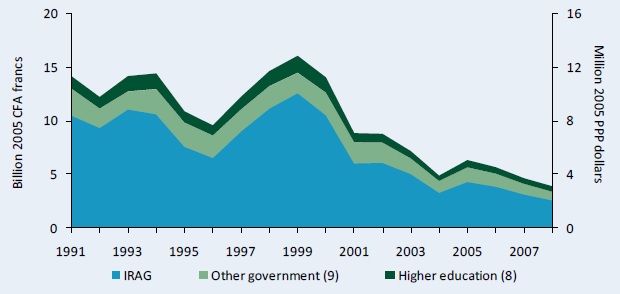
Source: Calculated by authors from IFPRI–IRAG 2009 and Stads and Béavogui 2003.
Notes: Figures in parentheses indicate the number of agencies in each category. For more information on coverage and estimation procedures, see asti.cgiar.org/guinea/datacoverage. Total agency sample includes one government agency, which discontinued its research activities in 2003.
Figure A2–Agricultural R&D spending in current CFA francs, 1991–2008
The long-term trend in national agricultural R&D spending was comparatively stable in current prices, even increasing since 2004, but it did not keep pace with national inflation rates (see Figure A1).
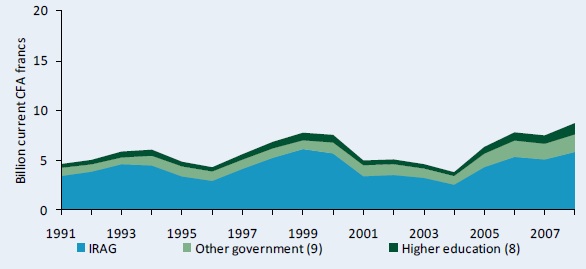
Source: Calculated by authors from IFPRI–IRAG 2009 and Stads and Béavogui 2003.
Note: Figures in parentheses indicate the number of agencies in each category.
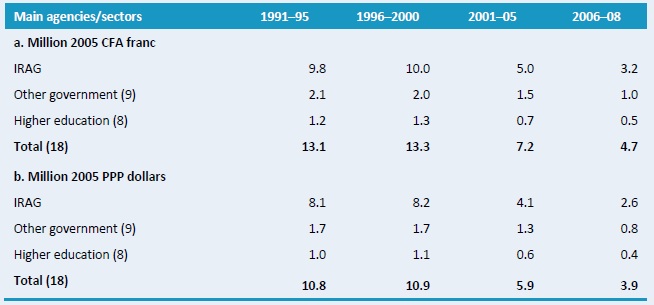
Table A1–Agricultural research spending, 1991–2008
The underlying data show that average spending on agricultural R&D in Guinea dropped significantly after 2000. During the 1990s, total spending levels averaged 13 billion CFA francs or 11 million PPP dollars, compared with only 4.7 billion CFA franc or 3.9 million PPP dollars during 2006–08. The average level of IRAG's 2006–08 expenditures equaled only a third of the levels recorded during the 1990s.
Source: Calculated by authors from IFPRI–IRAG 2009 and Stads and Béavogui 2003.
Notes: Figures in parentheses indicate the number of agencies in each category. Calculations are based on five-year averages with the exception of 2006–08, a three-year average. Expenditures for the eight higher education agencies were estimated. For more information, see asti.cgiar.org/guinea/datacoverage.
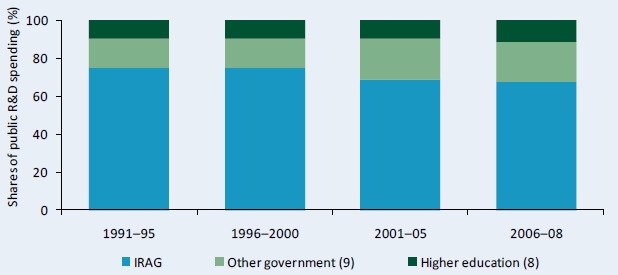
Figure A3–Shares of agricultural R&D spending by institutional category, 1991–2008
IRAG accounted for the largest share of expenditures over the entire period; however, other government and higher education agencies played an increasingly important role as a result of a stronger decline on IRAG's expenditures compared with the average decline at the other agencies. During 1991–95, other government agencies accounted for 16 percent of total agricultural R&D expenditures in Guinea compared with 21 percent during 2006–08. The higher education agencies also increased their share of overall expenditures from 9 percent during 1991–95 to 11 percent during 2006–08.
Source: Calculated by authors from IFPRI–IRAG 2009 and Stads and Béavogui 2003.
Notes: Figures in parentheses indicate the number of agencies in each category. Shares are based on five-year averages with the exception of 2006–08, a three-year average.
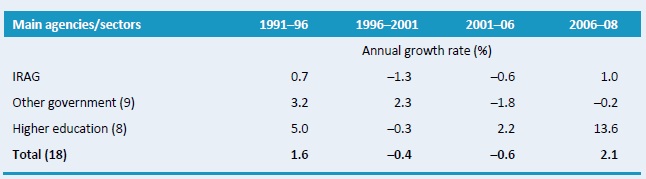
Table A2–Annual rates of R&D spending growth by institutional category, 1991–2008
Unsurprisingly, the yearly rate of growth in public agricultural R&D spending was negative for the entire period, except during 1996–2001. The end of the World Bank–funded National Agricultural Services Project (NASP) in 2000 precipitated a sharp decline in overall expenditures. With the conclusion of this and of other donor-funded projects, yearly rates of R&D spending growth across all agency groups fell sharply, becoming negative during 2001–08. The Institut Pasteur de Guinée (IPG) was the only agency to record positive expenditure growth rates during 2006–08 (1 percent).
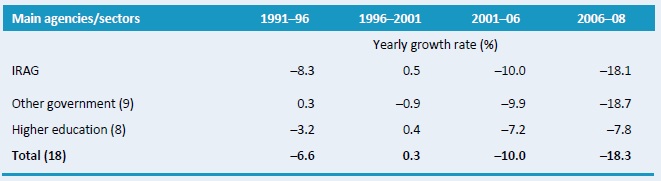
Source: Calculated by authors from IFPRI–IRAG 2009 and Stads and Béavogui 2003.
Notes: Figures in parentheses indicate the number of agencies in each category. Yearly growth rates were calculated using the least squares regression method. Expenditures for the eight higher education agencies were estimated. For more information, see asti.cgiar.org/guinea/datacoverage.
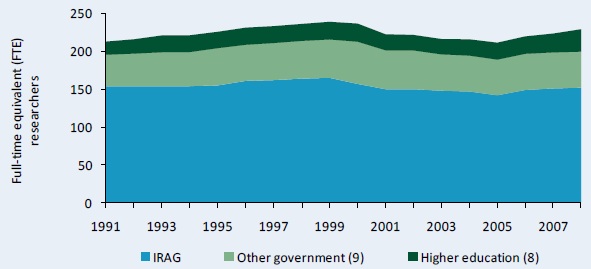
Figure A4–Agricultural research staffing in full-time equivalents, 1991–2008
Despite declining agricultural R&D expenditures, Guinean agricultural R&D capacity remained relatively stable. In 1991, the country employed 213 full-time equivalent (FTE) researchers, compared with 229 in 2008.
Source: Calculated by authors from IFPRI–IRAG 2009 and Stads and Béavogui 2003.
Notes: Figures in parentheses indicate the number of agencies in each category. For more information on coverage and estimation procedures, see asti.cgiar.org/guinea/datacoverage.
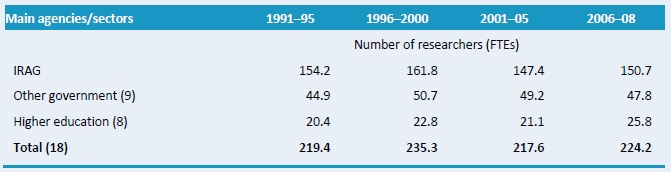
Table A3–Agricultural research staffing in full-time equivalents, 1991–2008
Average researcher numbers remained relatively constant during the 1991–2008 period, ranging from low of 218 to a high of 235.
Source: Calculated by authors from IFPRI–IRAG 2009 and Stads and Béavogui 2003.
Notes: Figures in parentheses indicate the number of agencies in each category. Calculations are based on five-year averages with the exception of 2006–08, a three-year average.
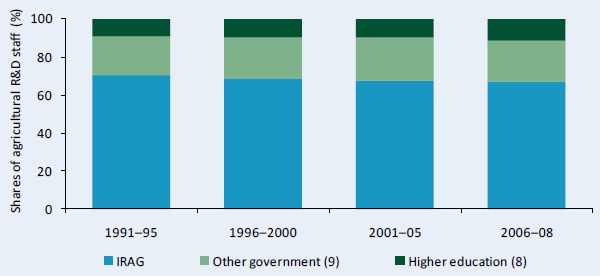
Figure A5–Shares of agricultural R&D staffing by institutional category, 1991–2008
The distribution of agricultural research staff across institutional categories changed little during 1991–2008. On average, IRAG accounted for two-thirds of all FTE researchers during 2006–08, compared with 70 percent during 1991–95. The other government and higher education agencies slightly increased their relative shares of agricultural R&D capacity, from 20 and 9 percent in 1991–95 to 21 and 12 percent during 2006–08, respectively.
Source: Calculated by authors from IFPRI–IRAG 2009 and Stads and Béavogui 2003.
Note: Figures in parentheses indicate the number of agencies in each category.
Table A4–Annual rates of growth in R&D staffing by institutional category, 1991–2008
Although overall yearly growth rates fluctuated little during 1991–2008, significant variations were recorded across institutional categories. Notably, the higher education agencies experienced relative high rates of growth during the early 1990s and 2006–08, whereas growth at the IRAG and other government agencies remained fairly stable throughout the period.
Source: Calculated by authors from IFPRI–IRAG 2009 and Stads and Béavogui 2003.
Notes: Figures in parentheses indicate the number of agencies in each category. Annual growth rates were calculated using the least squares regression method.
Table A5–Agricultural research intensity ratios, 1991–2008
All agricultural research intensity ratios fell dramatically during 1991–2008. Research spending as a share of agricultural gross domestic product (AgGDP) fell from $0.95 for every $100 of AgGDP to $0.36 during 2006–08. Also, the number of FTE researchers per million farmers declined by more than half–from 78 FTE researchers per million farmers in the early 1990s, to 30 FTEs during 2006–08.
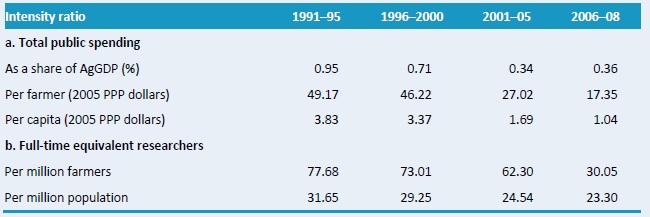
Sources: Calculated by authors from IFPRI–IRAG 2009 and Stads and Béavogui 2003.
Notes: Calculations are based on five-year averages with the exception of 2005–08, a three-year average. Research spending as a share of AgGDP is calculated using a weighted average. Farmers are defined as the economically active agricultural population (an FAO classification). Pre-1980 data on farmer data were not available.
Copyright (C) 2011 International Food Policy Research Institute (IFPRI) and Guinean Agricultural Research Institute (IRAG). Sections of this Data in Focus issue may be reproduced without the express permission of, but with acknowledgement to IFPRI and IRAG. This series is an output of the ASTI initiative and has not been peer reviewed. Any opinions stated herein are those of ASTI and do not necessarily reflect the policies and opinions of IFPRI or IRAG.