The ASTI Data in Focus series provides additional background data in support of the 2010 Country Note on Ghana (asti.cgiar.org/pdf/Ghana-Note.pdf) prepared by the Agricultural Science and Technology Indicators (ASTI) initiative and the Science and Technology Policy Research Institute (STEPRI). Based on data collected by ASTI and STEPRI, these two outputs review major investment and capacity trends in Ghanaian public agricultural research and development (R&D) since 1971, providing important updates on agricultural R&D trends prepared by ASTI and STEPRI in 2003–04.
C. Human Resources
This section provides detailed quantitative information on full-time equivalent (FTE) agricultural research and support staff trends, including qualifications, gender and age distribution, and support-staff-per-researcher ratios. Complementary sections of this issue on Ghana present detailed data on long-term trends (Section A), financial resources (Section B) and research allocation (Section D). Other supporting information provides macroeconomic trends, a list of agencies included in the study, data sources and estimation procedures, and ASTI’s methodology.
Table C1—Total researcher levels across various agencies, 2008
This table presents numbers and shares of FTE researchers across agencies for 2008. The Crop Research Institute (CRI) accounted for the largest share of agricultural R&D capacity in Ghana, at 14 percent. The next-largest agency in terms of FTE researchers—the Cocoa Research Institute of Ghana (CRIG)—employed 46 FTE researchers, representing 9 percent of the country’s total agricultural R&D capacity.
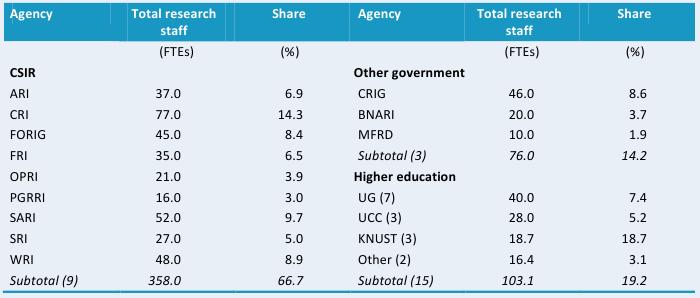
Source: Calculated by authors from IFPRI–STEPRI 2009.
Notes: Figures in parentheses indicate the number of agencies in each category. For more information on coverage and estimation procedures, see the Ghana country page on ASTI’s website at asti.cgiar.org/ghana/datacoverage. For full agency names see asti.cgiar.org/ghana/agencies.
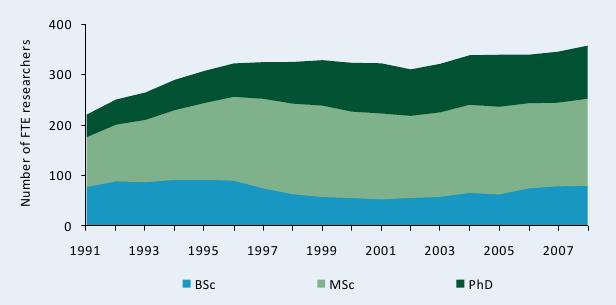
Figure C1—Full-time equivalent researcher trends at CSIR by degree, 1991–2008
The number of full-time equivalent (FTE) researchers at the nine agencies under the Council for Scientific and Industrial Research (CSIR) increased from 221 in 1991 to 358 in 2008. Notably, the majority of these additional researchers held postgraduate degrees. In 2008, 80 FTE researchers held BSc degrees, 173 were MSc-qualified, and 105 held PhD degrees.
Sources: Calculated by authors from ASTI–STEPRI 2009, Stads and Gogo 2004, BNARI 2007, KNUST 2010, and University of Ghana (various years).
Note: For more information on coverage and estimation procedures, see the Ghana country page on ASTI’s website at asti.cgiar.org/ghana/datacoverage.
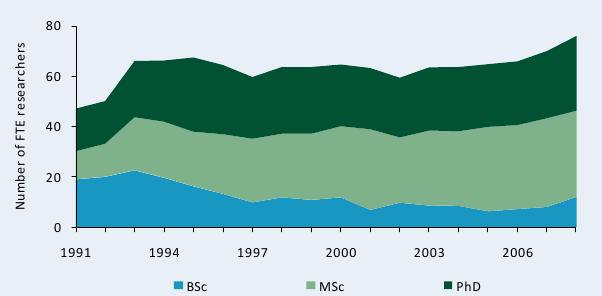
Figure C2—Full-time equivalent researcher trends at the other government agencies by degree, 1991–2008
FTE research capacity at the other government agencies also increased during 1991–2008, both in terms of numbers and qualifications. In 1991, the government-sector agencies employed a total of 47 FTE researchers, 17 of which PhD degrees; in 2008, this total had risen to 76 FTEs, of which 30 held PhD degrees.
Sources: Calculated by authors from ASTI–STEPRI 2009, Stads and Gogo 2004, BNARI 2007, KNUST 2010, and University of Ghana (various years).
Notes: The government agencies included in this figure are BNARI, MFRD, and CRIG; remaining agencies were excluded because data were incomplete. For a complete list of the agencies included in our sample, see asti.cgiar.org/ghana/agencies.
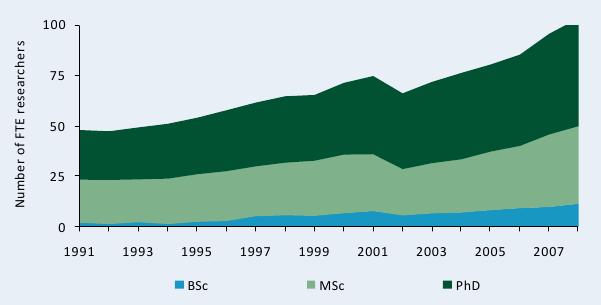
Figure C3—Full-time equivalent researcher trends at higher education agencies by degree, 1991–2008
During 1991–2008, the 11 higher education agencies for which long-term degree data were available also benefited from steady increases of FTE researcher numbers. Most of this growth occurred in the category of PhD-qualified staff. In 1991, 25 of 48 FTE researchers employed in the higher education sector held PhD degrees, compared with 47 of 88 FTE researchers in 2008. This is consistent with the worldwide trend indicating that staff employed in the higher education sector are generally more highly qualified (based on their teaching mandate) than those employed by government-sector agricultural R&D agencies.
Sources: Calculated by authors from ASTI-STEPRI 2009; Stads and Gogo 2004; BNARI 2007; KNUST 2010; and University of Ghana, various years.
Notes: Higher education researcher by degree data excludes UG-DOF, KNUST-FACS-BIO, KNUST-IRNR, and UCEW-CoAE because of incomplete data. For a complete list of the agencies included in our sample, see asti.cgiar.org/ghana/agencies.
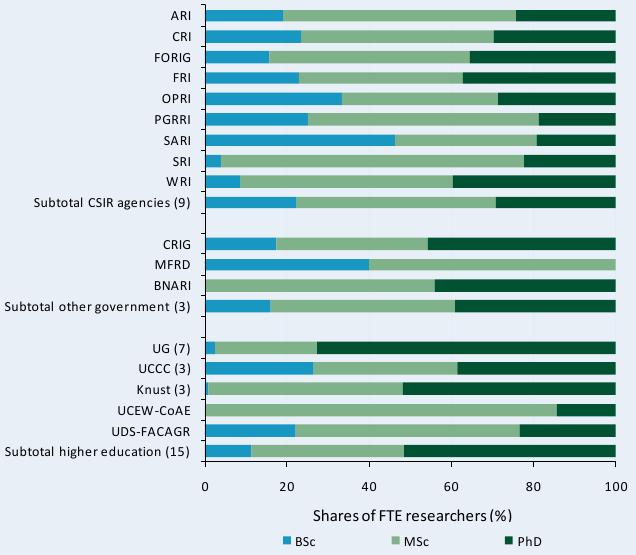
Figure C4—Distribution of researcher qualifications across various agencies, 2008
This figure presents the distribution of researcher qualifications across agencies in 2008. Combined, the various units under the University of Ghana (UG) had the highest share of FTE researcher staff holding PhD degrees (73 percent). In contrast, about half of the FTE researchers at the three entities under Kwame Nkrumah University of Science and Technology (KNUST) only held BSc degrees. Among the CSIR agencies, the Savanna Agricultural Research Institute (SARI) and the Plant Genetic Resources Research Institute (PGRRI) had the highest proportion of PhD- qualified researchers. Of the three non-CSIR government agencies, more than 40 percent of theFTE researchers at CRIG and the Biotechnology and Nuclear Agricultural Research Institute (BNARI) held PhD degrees, whereas no PhD-qualified researchers were employed at the Marine Fisheries Research Division (MFRD).
Sources: Calculated by authors from IFPRI–STEPRI 2009, BNARI 2007, KNUST 2010, and University of Ghana (various years).
Notes: Data on researchers employed in the higher education sector exclude UG-DOF, KNUST-FACS-BIO, KNUST-IRNR, and UCEW-CoAE because data were incomplete. For a complete list of the agencies included in our sample, see asti.cgiar.org/ghana/agencies.
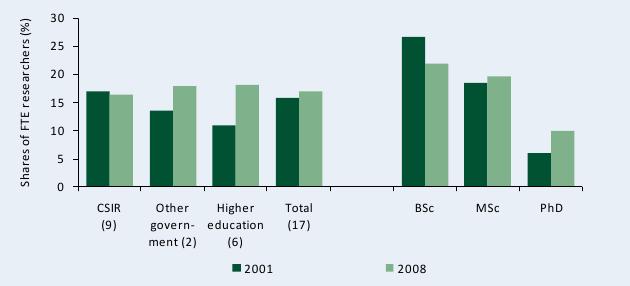
Figure C5—Female share of researchers by degree and institutional category, 2001 and 2008 Shares of FTE researchers (%)
Female researchers constituted 17 percent of total Ghanaian agricultural research staff in 2008. Gender shares—both aggregated and by individual agency—changed little compared with comparable 2001 data. Share of PhD-qualified female rose from 6 percent in 2001 to 10 percent in 2008.
Sources: Calculated by authors from IFPRI–STEPRI 2009 and Stads and Gogo 2004.
Notes: Figures in parentheses indicate the number of agencies in each category. Gender data for other government agencies exclude BNARI because 2008 data were unavailable. Gender data for the higher education agencies include UG-FACAGR, UG-ISSER, UC-BS, UCC-CDS, UDS-FACAGR, and UCEW-CoAE. For a complete list of the agencies included in our sample, see asti.cgiar.org/ghana/agencies.
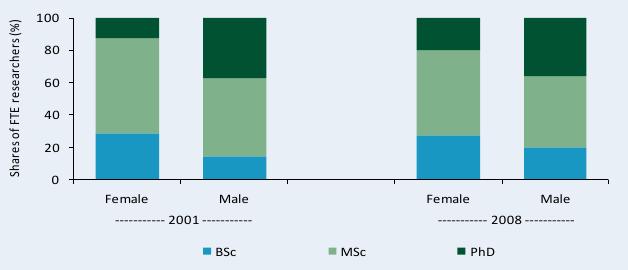
Figure C6—Distribution of researcher qualifications by gender, 2001 and 2008
This figure illustrates the relative level of researcher qualifications by gender in 2001 and 2008. The share of male PhD-qualified staff remained relatively constant during this timeframe, whereas the share of female PhD-qualified staff grew from 13 percent in 2001 to 20 percent in 2008.
Sources: Calculated by authors from IFPRI–STEPRI 2009 and Stads and Gogo 2004.Note: See Figure C5 for details of sample size.
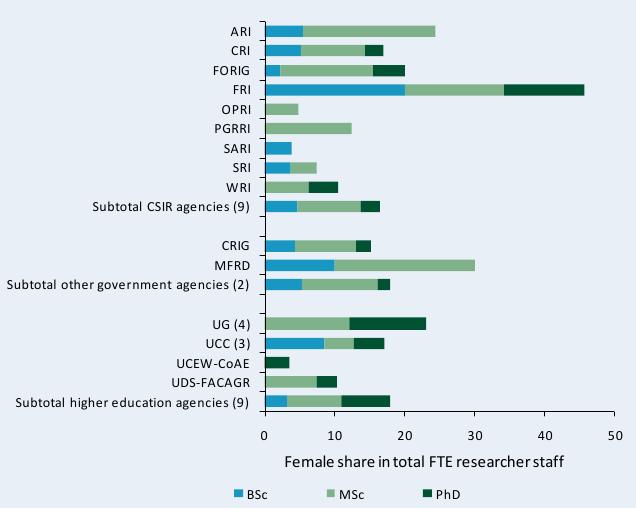
Figure C7— Female share in total FTE research staff by degree across various agencies, 2008
This figure illustrates the wide variation in the shares of degree qualifications among female staff across the various agencies in 2008. The Food Research Institute (FRI) employed the largest share of female researchers (46 percent). Shares at the CSIR agencies varied significantly, from lows of 4 to 7 percent at SARI, the Oil Palm Research Institute (OPRI), and the Soil Research Institute (SRI), to highs of 24 percent at the Animal Research Institute (ARI) and 20 percent at the Forestry Research Institute of Ghana (FORIG). At the Cocoa Research Institute of Ghana (CRIG) and the Marine Fisheries Research Division of the Ministry of Agriculture (MFRD), 2008 shares of female researchers were 15 and 30 percent, respectively. Shares at higher education agencies varied widely, ranging from 4 percent at the University of Education, Winneba, College of Agriculture Education (UCEW-CoAE) to 23 percent at the University of Ghana.
Source: Calculated by authors from IFPRI–STEPRI 2009.
Note: See Figure C5 for details of sample size.
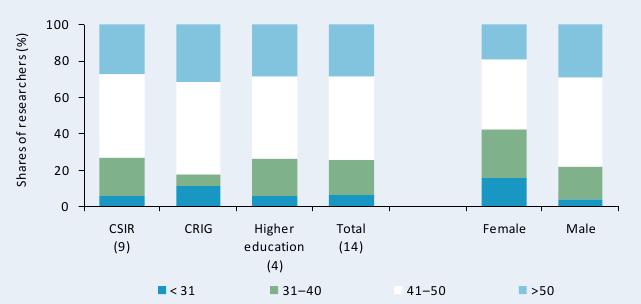
Figure C8—Age distribution by institutional category and gender, 2007
This figure illustrates the distribution of researchers by age at CSIR, CRIG, and four higher education agencies, disaggregated by agency and gender. At these agencies, the large majority of researchers were over 40 years old in 2007, and around half were between the ages 41 and 50. In addition, male researchers were older than their female colleagues: in 2007, 78 percent of the male researchers were older than 40 compared with only 58 percent of female researchers.
Sources: Calculated by authors from ASTI–AWARD 2008/09.
Notes: Figures in parentheses indicate the number of agencies in each category. Data on age distribution for higher education agencies only include UG-CACS, KNUST-CANS, UDS-FA, and UCC-SA.
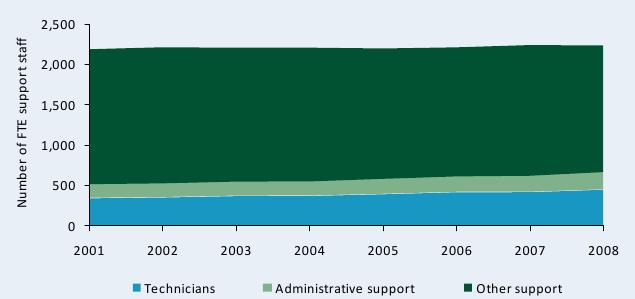
Figure C9—Trends in full-time equivalent support staff at CSIR, 2001–08
The overall number of FTE support staff at the nine CSIR agencies—including, technicians, administrative, and other support staff—remained fairly stable in 2008 and totaled 2,235. The majority of technicians held a degree or diploma, but relatively few held BSc or higher level degree. In 2008, one technician held an MSc degree and 34 held BSc degrees, whereas 413 technicians held a diploma or other type of qualification.
Sources: Calculated by authors from IFPRI–STEPRI 2009 and Stads and Gogo 2004.
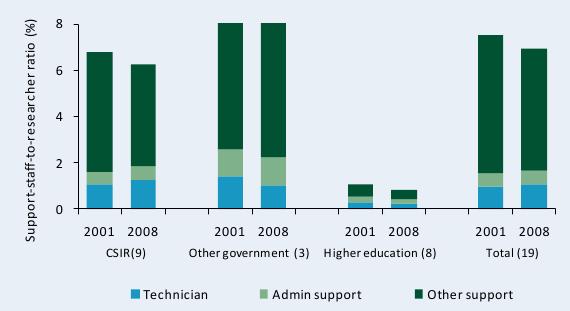
Figure C10—Support-staff-per-researcher ratio by institutional category, 2001 and 2008
On average, the support-staff-per-researcher ratio fell marginally, from 7.5 in 2001 to 6.9 in 2008. That year, for every agricultural researcher, Ghana employed 1.1 technicians, 0.6 administrative staff, and 5.3 other support staff. In general, the government agencies reported much higher support-staff ratios compared with the higher education agencies, which is a common finding across countries because research is not the primary mandate of higher education agencies. Given that on-farm research requires large numbers of agricultural workers, CRIG, the Soil Research Institute (SRI), and the PGRRI all reported support-staff ratios higher than 10. The slight decrease in the support-staff-per-researcher ratio at CSIR stemmed from an effective employment freeze from 2004 to 2008. As of 2010, recruitment required the prior approval of
the director general based on stringent needs assessment.
Sources: Calculated by authors from IFPRI–STEPRI 2009 and Stads and Gogo 2004.
Notes: Figures in parentheses indicate the number of agencies in each category. For more information on coverage and estimation procedures, see the Ghana country page on ASTI’s website at asti.cgiar.org/ghana/datacoverage.