The ASTI Data in Focus series provides additional background data in support of the 2010 Country Note on Ghana (asti.cgiar.org/pdf/Ghana-Note.pdf) prepared by the Agricultural Science and Technology Indicators (ASTI) initiative and the Science and Technology Policy Research Institute (STEPRI). Based on data collected by ASTI and STEPRI, these two outputs review major investment and capacity trends in Ghanaian public agricultural research and development (R&D) since 1971, providing important updates on agricultural R&D trends prepared by ASTI and STEPRI in 2003–04.
B. Financial Resources
This section provides detailed quantitative information on expenditures in Ghanaian public agricultural R&D for the period 1991–2008. Complementary sections in this issue on Ghana present detailed data on long-term trends (Section A), human resources (Section C), and research allocation (Section D). Other supporting information provides macroeconomic trends, a list of agencies included in the study, data sources and estimation procedures, and ASTI’s methodology.
Table B1—Total spending levels across various agencies in billion 2005 Ghanaian cedis, 2008
This table presents spending levels in billion 2005 Ghanaian cedis across agencies. The Crop Research Institute (CRI) is the largest institute under the Council for Scientific and Industrial Research (CSIR) and accounts for 13 percent of overall expenditures. The Cocoa Research Institute of Ghana (CRIG) accounted for 35 percent of all agricultural R&D expenditures in Ghana in 2008 (124 billion 2005 Ghanaian cedis), making it the largest agricultural R&D agency in Ghana.
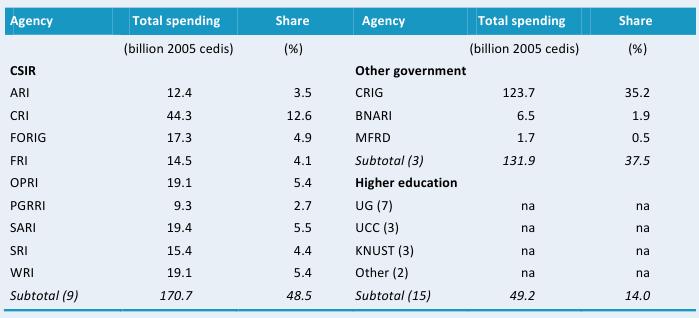
Source: Calculated by authors from IFPRI–STEPRI 2009.
Note: Figures in parentheses indicate the number of agencies in each category. Expenditures for the 15 higher education agencies were estimated. For more information on coverage and estimation procedures, see the Ghana country page on ASTI’s website at asti.cgiar.org/ghana/datacoverage. For full agency names see asti.cgiar.org/ghana/agencies.
Figure B1—CSIR’s spending by cost-category adjusted for inflation, 1991–2008
From 1991 to 2008, spending on salaries increased substantially at the nine agriculture-related institutes under CSIR, which reflects not only the growing number of researchers, but also an increase in staff salaries and benefits. In 2008, CSIR agencies spent 141.9 billion cedis or 38.1 million PPP dollars on salaries compared with 33.5 billion cedis or 9.0 million PPP dollars in 1991 (in 2005 prices). During the same period, operating and capital costs changed very little.
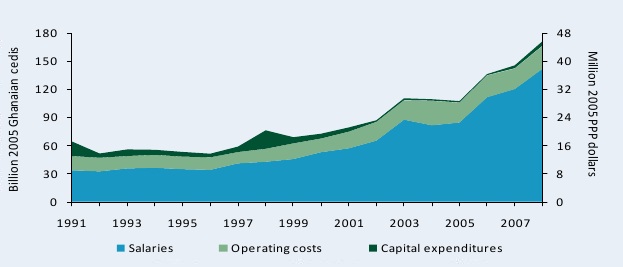
Sources: Calculated by authors from ASTI–STEPRI 2009 and Stads and Gogo 2004.
Notes: Financial data are presented in “old” Ghanaian cedis. The “new” cedi was introduced on July 3, 2007, and equals 10,000 ”old” cedis. For more information on coverage and estimation procedures, see asti.cgiar.org/ghana/datacoverage.
Figure B2—Distribution of CSIR agencies’ spending by cost-category, 2008
This figure shows the distribution of 2008 spending by cost category across the nine CSIR agencies. Six of the nine agencies under CSIR allocated more than 80 percent of their expenditures to staff salaries, while shares for the remaining three CSIR agencies ranged between 67 and 76 percent. The Water Research Institute (WRI) allocated the largest share of its expenditures to capital investments, whereas the Oil Palm Research Institute (OPRI) and the Savanna Agricultural Research Institute (SARI) made no capital investments in 2008.
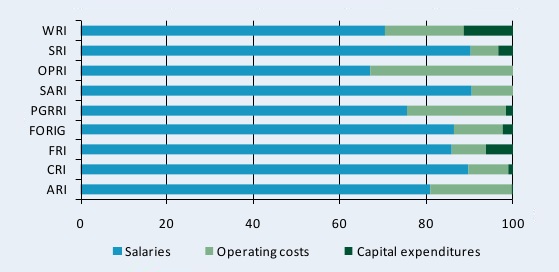
Source: Calculated by authors from ASTI–STEPRI 2009.
Note: For more information on coverage and estimation procedures, see the Ghana country page on ASTI’s website at asti.cgiar.org/ghana/datacoverage. For a complete list of the agencies included in our sample, see asti.cgiar.org/ghana/agencies.