The ASTI Data in Focus series provides additional background data in support of the 2010 Country Note on Ethiopia (asti.cgiar.org/pdf/Ethiopia-Note.pdf) prepared by the Agricultural Science and Technology Indicators (ASTI) initiative and the Ethiopian Institute of Agricultural Research (EIAR). Based on data collected by ASTI and EIAR, these two outputs review major investment and capacity trends in Ethiopian public agricultural research and development (R&D) since 1971, providing important updates on agricultural R&D trends prepared by ASTI and EIAR in 2003–04.
C. Human Resources
This section provides detailed quantitative information on trends in full-time equivalent (FTE) agricultural research and support staff, including qualifications, gender and age distribution, and support-staff-per-researcher ratios. Complementary sections present detailed data on long-term trends (Section A), financial resources (Section B), and research allocation (Section D). Other supporting information provides macroeconomic trends, a list of agencies included in the study, data sources and estimation procedures, and ASTI's methodology.
Table C1–Total researcher numbers across various agencies, 2008
This table presents numbers and shares of full-time equivalent (FTE) researchers across agencies in 2008. The Ethiopian Institute of Agricultural Research (EIAR) accounted for the largest share of agricultural R&D capacity in Ethiopia, at 42 percent. The next-largest agency in terms of FTE researchers–the Oromia Agricultural Research Institute (OARI)–employed 172 FTE researchers, representing 13 percent of the country's total agricultural R&D capacity. In 2008, the combined researcher capacity of the seven RARIs was higher than that of EIAR.
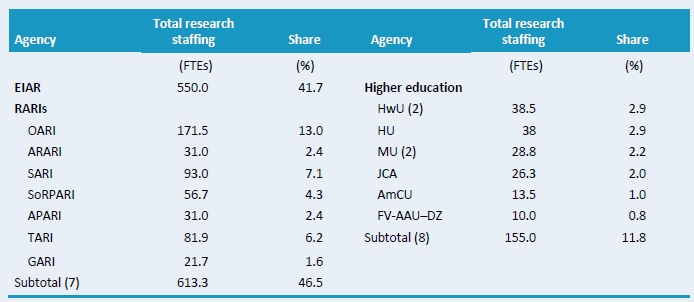
Source: Calculated by authors from ASTI–EIAR 2009–10.
Notes: Figures in parentheses indicate the number of agencies in each category. For more information on coverage and estimation procedures, see the Ethiopia's country page on ASTI's website at asti.cgiar.org/ethiopia/datacoverage. For full agency names see asti.cgiar.org/ethiopia/agencies.
Figure C1–Full-time equivalent researcher trends at EIAR by degree, 1997–2008
The number of researchers at EIAR steadily increased from 1997 onward, peaking at 646 FTEs in 2005 and declining thereafter. In 2008, EIAR employed 550 FTE researchers of which 22 percent were PhD qualified; 45 percent, MSc qualified; and 40 percent, BSc qualified.
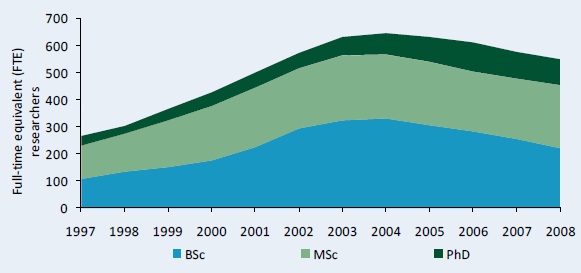
Source: Calculated by authors from Beintema and Solomon 2003 and ASTI–EIAR 2009–10.
Note: EIAR was known as the Ethiopian Agricultural Research Organization (EARO) until it was renamed in 2005.
Figure C2–Full-time equivalent researcher trends at the RARIs by degree, 1997–2008
FTE research capacity at the regional agricultural research institutes (RARIs) more than tripled from the time of their establishment in the late-1990s (when researchers were redeployed from EIAR) until 2008. In 1998, the seven RARIs combined employed a total of 177 FTE researchers, 4 of which held PhD degrees; in 2008, this total had risen to 613 FTEs, 27 of which held PhD degrees. By 2008, the combined capacity of the seven RARIs was higher than that of EIAR in terms of researcher numbers but not postgraduate qualifications (see also Figure C1).
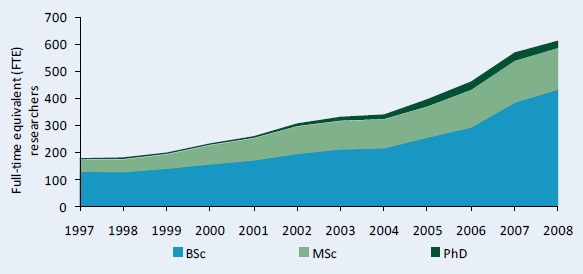
Source: Calculated by authors from Beintema and Solomon 2003 and ASTI–EIAR 2009–10.
Note: For a complete list of the agencies included in our sample, see asti.cgiar.org/ethiopia/agencies.
Figure C3–Distribution of researcher qualifications across various agencies, 2008
Looking at individual agencies, the Faculty of Veterinary Medicine at the University of Addis Ababa, Debre Zeit (FV-AAU–DZ) and Haramaya University (HU) reported the highest shares of PhD researchers (30 and 28 percent, respectively). Two agencies, the Afar Pastoral and Agro-Pastoral Research Institute (APARI) and the Gambela Agricultural Research Institute (GARI), employed no PhD-qualified researchers.
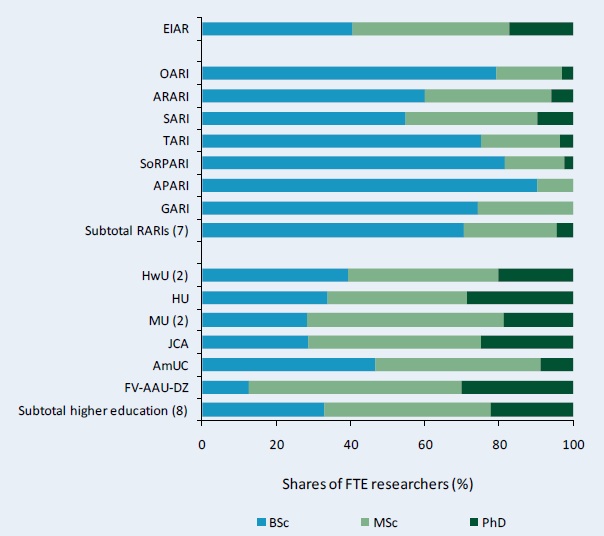
Source: Calculated by authors from Beintema and Solomon 2003 and ASTI–EIAR 2009–10.
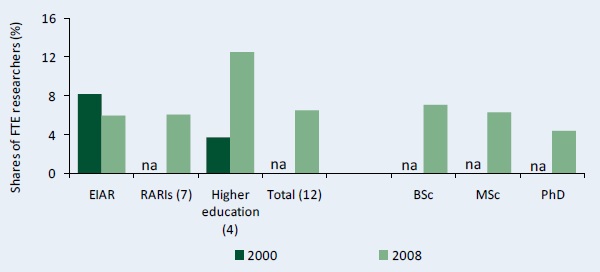
Figure C4–Female share of researchers by degree and institutional category, 2001 and 2008
Female researchers constituted an average of 7 percent of all Ethiopian agricultural research staff in 2008. At EIAR, the share of female researchers decreased slightly, from 8 percent in 2000 to 6 percent in 2008. In contrast, the share of female researchers at the higher education agencies increased from 4 to 13 percent during this timeframe. Across degree levels, the highest share of female researchers in 2008, at 7 percent, was among researchers qualified to the BSc level.
Source: Calculated by authors from Beintema and Solomon 2003 and ASTI–EIAR 2009–10.
Notes: Figures in parentheses indicate the number of agencies in each category. Gender data were not available in 2000 for the RARIs, and only FV-AAU–DZ, HU, FDANR-MU, and JCA were included in the higher education sector because 2000 data for the other agencies were not available. For a complete list of the agencies included in our sample, see asti.cgiar.org/ethiopia/agencies.
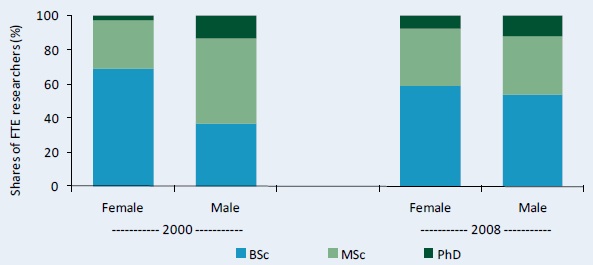
Figure C5–Distribution of researcher qualifications by gender, 2000 and 2008
This figure illustrates the relative levels of researcher qualifications by gender in 2000 and 2008. Among female researchers, the shares of PhD and MSc-qualified researchers increased. In 2008, 8 percent of female researchers held PhD degrees, and 33 percent held MSc degrees, compared with 2000, when 3 percent of female researchers held PhD degrees, and 28 percent held MSc degrees.
Source: Calculated by authors from Beintema and Solomon 2003 and ASTI–EIAR 2009–10.
Note: See Figure C5 for details of sample size.
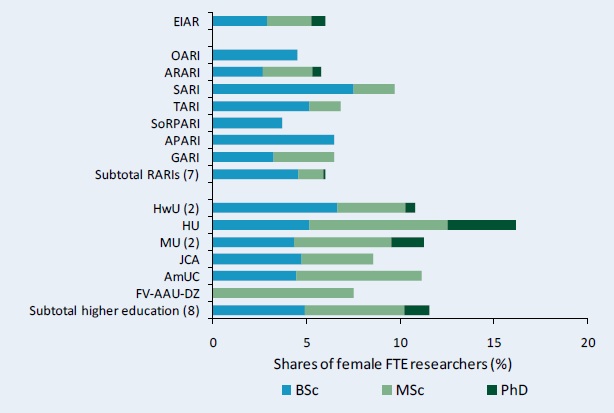
Figure C6–Female share of FTE researchers across various agencies by degree, 2008
This figure illustrates the wide variation in the shares of degree qualifications among female researchers at the various agencies in 2008. HU employed the largest share of female researchers (16 percent). Shares across government agencies were lower than those at the higher education agencies, which is a common finding across countries. Female researchers accounted for between 4 and 10 percent of researchers employed at government agencies, whereas at the higher education agencies shares were between 9 and 16 percent. Across all agencies, the majority of female researchers were qualified to the BSc-level only, with the exception of FV-AAU–DZ, where all the female researchers held MSc degrees.
Source: Calculated by authors from ASTI–EIAR 2009–10.
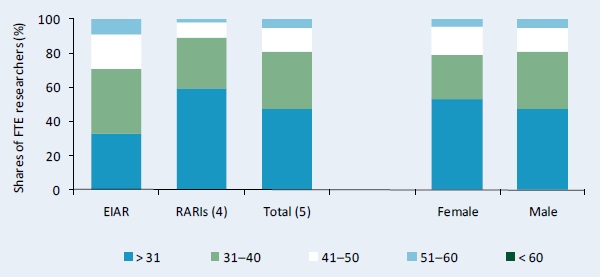
Figure C7–Age distribution by institutional category and gender, 2007
This figure illustrates the distribution of researchers by age at EIAR and four of the RARIs, disaggregated by agency and gender. The majority of researchers at these agencies were under 41 years old in 2007. The RARIs employed the youngest research staff overall, with almost 60 percent being under 31 years old in 2007. Male researchers were slightly older than their female colleagues.
Source: Calculated by authors from ASTI–AWARD 2008/09.
Note: Figures in parentheses indicate the number of agencies in each category.
Figure C8–Trends in full-time equivalent support staff at EIAR, 2001–08
The overall number of FTE support staff at EIAR–including, technicians, and administrative and other support staff–increased from 2,173 in 2001 to 2,695 in 2008. Most technicians were not degree qualified. 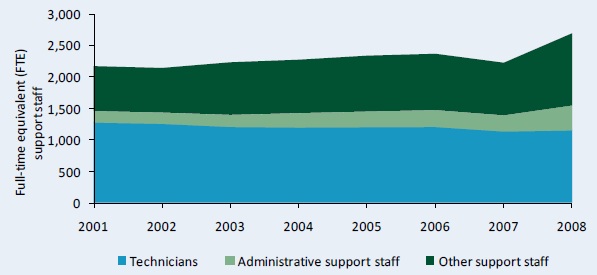
Source: Calculated by authors from ASTI–EIAR 2009–10.
Figure C9–Support-staff-per-researcher ratios by institutional category, 2001 and 2008
The support-staff-per-researcher ratio fell marginally on average, from 3.8 in 2001 to 3.4 in 2008. That year, for every agricultural researcher, Ethiopia employed 1.5 technicians, 0.8 administrative staff, and 1.1 other support staff.
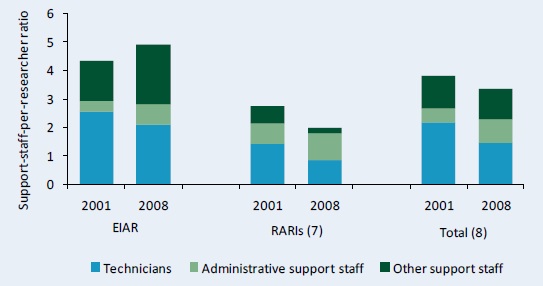
Source: Calculated by authors from ASTI–EIAR 2009–10.
Notes: Figures in parentheses indicate the number of agencies in each category. For more information on coverage and estimation procedures, see the Ethiopia's country page on ASTI's website at asti.cgiar.org/ethiopia/datacoverage.
Copyright (C) 2011 International Food Policy Research Institute and Ethiopian Institute of Agricultural Research. Sections of this Data in Focus issue may be reproduced without the express permission of, but with acknowledgment to, IFPRI and EIAR. The Data in Focus series is an output of the ASTI initiative and has not been peer reviewed. Any opinions stated herein are those of ASTI and do not necessarily reflect the policies and opinions of IFPRI or EIAR.