The ASTI Data in Focus series provides additional background data in support of the 2010 Country Note on Ethiopia (asti.cgiar.org/pdf/Ethiopia-Note.pdf) prepared by the Agricultural Science and Technology Indicators (ASTI) initiative and the Ethiopian Institute of Agricultural Research (EIAR). Based on data collected by ASTI and EIAR, these two outputs review major investment and capacity trends in Ethiopian public agricultural research and development (R&D) since 1971, providing important updates on agricultural R&D trends prepared by ASTI and EIAR in 2003–04.
Long-Term Trends
This section provides detailed quantitative information on long-term investment and capacity trends in Ethiopian public agricultural R&D for the period 1971–2008. Subsequent sections present detailed data on financial resources (Section B), human resources (Section C), and research allocation (Section D). Other supporting information provides macroeconomic trends, a list of agencies included in the study, data sources and estimation procedures, and ASTI's methodology.
Figure A1–Agricultural R&D spending adjusted for inflation, 1971–2008
After a period of relative stability, agricultural research and development (R&D) expenditures in Ethiopia doubled between 1993 and 2000 and then doubled again between 2000 and 2001. From 2003, however, investments began to decline, reaching 157 million birr or 70 million PPP dollars by 2008 (both in 2005 constant prices). The 2008 value of investment, although lower compared with 2001–02 levels, was still significantly higher than those of the 1990s. This was mostly the result of the growth of at regional agricultural research institutes (RARIs).
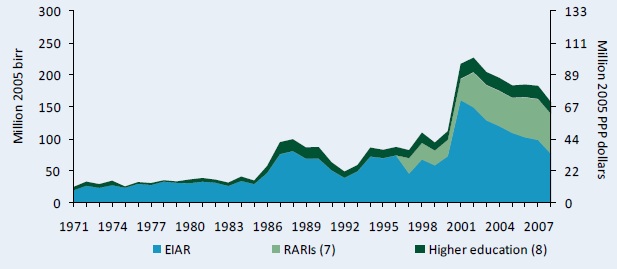
Source: Calculated by authors from Beintema and Solomon 2003, ASTI–EIAR 2009–10, and various financial files from EIAR.
Notes: Figures in parentheses indicate the number of agencies in each category. Dates correspond to a July–June fiscal year. 1998–2005 spending data for EIAR were partly based on budget data rather than actual expenses. EIAR was known as the Ethiopian Agricultural Research Organization (EARO) until it was renamed in 2005. For more information on coverage and estimation procedures, see the Ethiopia country page on ASTI's website at asti.cgiar.org/ethiopia.
Figure A2–Agricultural R&D spending in current Ethiopian birr, 1993–2008
In current prices, fluctuations in agricultural R&D spending were less pronounced. Moreover, total agricultural R&D spending increased after 2005 in current prices, contrasting the opposite trend when prices are adjusted for inflation (see Figure A1). In 2008, Ethiopia spent 264 million current Ethiopian birr on agricultural R&D compared with 157 million birr in inflation-adjusted 2005 prices.
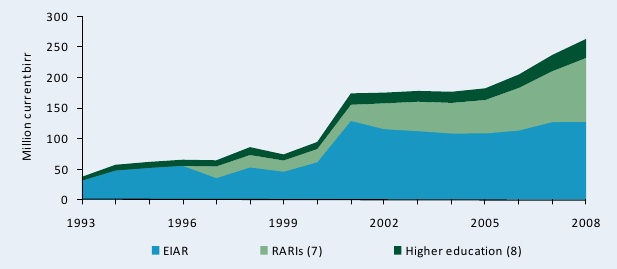
Source: Calculated by authors from Beintema and Solomon 2003, ASTI–EIAR 2009–10, and various financial files from EIAR.
Note: Figures in parentheses indicate the number of agencies in each category.
Table A1–Agricultural research spending, 1971–2008
The underlying data show large increases in spending at the Ethiopian Institute of Agricultural Research (EIAR), including its predecessors, with the exception of a sharp decline during the early 1990s and a more moderate decline during 2006–08. These contractions in spending resulted from reduced funding from the government and donors. Expenditures at the RARIs, which were only established in the late 1990s, rose quickly, more than tripling by 2006–08.
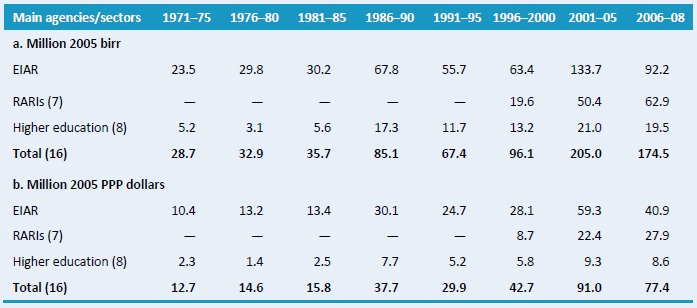
Source: Calculated by authors from Beintema and Solomon 2003, ASTI–EIAR 2009–10, and various financial files from EIAR.
Notes: Figures in parentheses indicate the number of agencies in each category. Calculations are based on five-year averages with the exception of 2006–08, a three-year average. Expenditures for the eight higher education agencies were estimated. For more information, see asti.cgiar.org/ethiopia/datacoverage.
Figure A3–Shares of agricultural R&D spending by institutional category, 1971–2008
This figure provides relative levels of public agricultural R&D spending by institutional category, in addition to the absolute values presented in Figures A1 and A2. From the early 1970s until the early 1990s, EIAR accounted for between 80 and 90 percent of total agricultural R&D expenditures. Since the decentralization of the Ethiopian agricultural research system in 1997, however, the role of the RARIs has grown from 20 percent of public agricultural R&D expenditures following their establishment in the late–1990s to 36 percent during 2006–08.
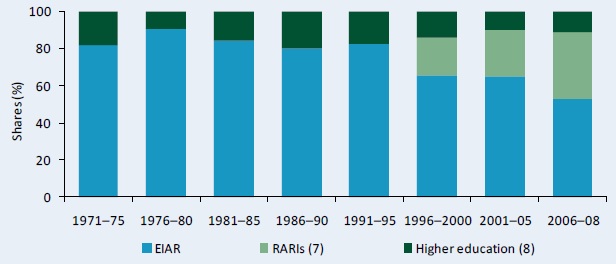
Source: Calculated by authors from Beintema and Solomon 2003, ASTI–IAR 2009–10, and various financial files from EIAR.
Notes: Figures in parentheses indicate the number of agencies in each category. Shares are based on five-year averages with the exception of 2006–08, a three-year average.
Table A2–Annual rates of R&D spending growth by institutional category, 1971–2008
Yearly growth rates illustrate the aforementioned fluctuations in agricultural R&D spending. Average rates remained positive until 2001, thereafter turning sharply negative. Despite the overall negative growth during 2006–08, two of the seven RARIs–the Somali Region Pastoral and Agro-Pastoral Research Institute (SoRPARI) and the Afar Pastoral and Agro-pastoral Research Institute (APARI)–experienced strong positive growth of 36 and 16 percent, respectively.
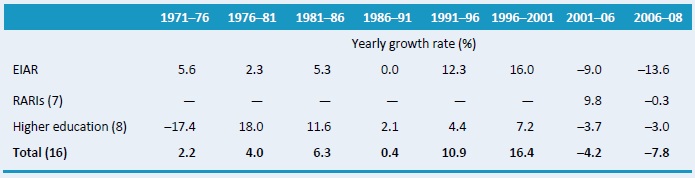
Source: Calculated by authors from Beintema and Solomon 2003, ASTI–EIAR 2009–10, and various financial files from EIAR.
Notes: Figures in parentheses indicate the number of agencies in each category. Yearly growth rates were calculated using the least squares regression method. Expenditures at the eight higher education agencies were estimated. For more information, see asti.cgiar.org/ethiopia/datacoverage.
Figure A4–Public agricultural research staff in full-time equivalents, 1971–2008
The total number of agricultural researchers in full-time equivalents (FTE) increased substantially, from only 60 in 1971 to 1,318 in 2008. The decrease in the number of FTE researchers at EIAR in 1997 represents the aforementioned creation of the regional RARIs.
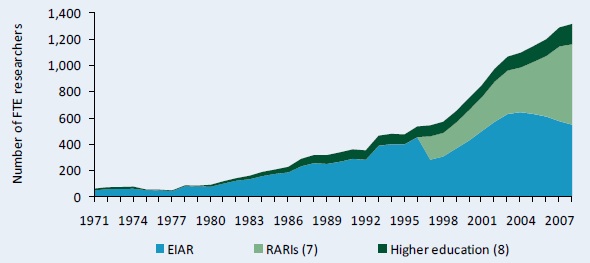
Source: Calculated by authors from Beintema and Solomon 2003, ASTI–EIAR 2009–10, AET-Africa 2010; and Mekele University 2010a and 2010b.
Notes: Figures in parentheses indicate the number of agencies in each category. Dates correspond to a July–June fiscal year. EIAR was known as the Ethiopian Agricultural Research Organization (EARO) until it was renamed in 2005.
Table A3–Public agricultural research staffing in full-time equivalents, 1971–2008
Disaggregated data illustrate the strengthening of human resource capacity in Ethiopia's agricultural R&D system over time. Note that declines at EIAR corresponded to the establishment of the RARIs in the late-1990s, and the associated transfer of staff. Note also that, despite the transfer of staff to the RARIs, capacity continued to grow at EIAR during 1996–2008.
Source: Calculated by authors from Beintema and Solomon 2003, ASTI–EIAR 2009–10, AET-Africa 2010, and Mekele University 2010a and 2010b.
Notes: Figures in parentheses indicate the number of agencies in each category. Calculations are based on five-year averages with the exception of 2006–08, a three-year average.
Figure A5–Shares of public agricultural R&D staff numbers by institutional category, 1971–2008
This figure shows the relative levels of FTE researchers across institutional categories. Similar to the trend in expenditures, EIAR accounted for 80 to 90 percent of agricultural R&D capacity until the late-1990s, when the RARIs were established. During 2006–08, EAIR accounted for 46 percent of total agricultural R&D capacity, the RARIs accounted for 43 percent, and the higher education sector accounted for 11 percent.
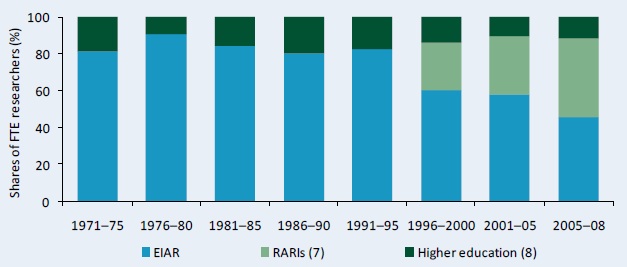 Source: Calculated by authors from Beintema and Solomon 2003, ASTI–EIAR 2009–10, AET-Africa 2010, and Mekele University 2010a and 2010b.
Note: Figures in parentheses indicate the number of agencies in each category.
Table A4–Annual rates of growth in R&D staffing by institutional category, 1971–2008
Average yearly growth in agricultural R&D researcher numbers remained high from the mid- 1970s, and increased from the mid-1990s due to the establishment of the RARIs.
Source: Calculated by authors from Beintema and Solomon 2003, ASTI–EIAR 2009–10, AET-Africa 2010, and Mekele University 2010a and 2010b.
Notes: Figures in parentheses indicate the number of agencies in each category. Yearly growth rates were calculated using the least squares regression method.
Table A5–Various agricultural research intensity ratios, 1971–2008
Average agricultural R&D spending as a share of agricultural GDP (AgGDP) fluctuated between 0.13 and 0.54 percent during 1971–2008, which is in line with changing levels of AgGDP, as well as agricultural R&D investment. During 2006–08, the ratio dropped to 0.31 percent as a result of decreased agricultural R&D spending. FTE researchers per million farmers and per million population rose steadily throughout the period. Intensity ratio
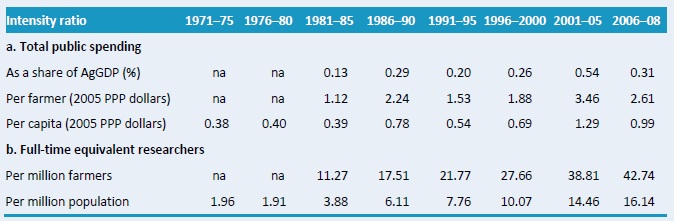
Source: Calculated by authors from Beintema and Solomon 2003, FAO 2009, World Bank 2009, ASTI–EIAR 2009–10, AET-Africa 2010, and Mekele University 2010a and 2010b.
Notes: Calculations are based on five-year averages with the exception of 2005–08, a three-year average. Research spending as a share of AgGDP is calculated using a weighted average. Farmers are defined as the economically active agricultural population (an FAO classification). Pre-1980 data on farmer numbers were not available.
Copyright (C) 2011 International Food Policy Research Institute and Ethiopian Institute of Agricultural Research. Sections of this Data in Focus issue may be reproduced without the express permission of, but with acknowledgment to, IFPRI and EIAR. The Data in Focus series is an output of the ASTI initiative and has not been peer reviewed. Any opinions stated herein are those of ASTI and do not necessarily reflect the policies and opinions of IFPRI or EIAR.