The ASTI Data in Focus series provides additional background data in support of the 2010 Country Note on Côte d'Ivoire (asti.cgiar.org/pdf/CotedIvoire-Note.pdf) prepared by the Agricultural Science and Technology Indicators (ASTI) initiative and the National Center for Agricultural Research (CNRA). Based on data collected by ASTI and CNRA, these two outputs review major investment and capacity trends in Ivorian public agricultural research and development (R&D) since 1981, providing important updates on agricultural R&D trends prepared by ASTI in 2000 - 03.
Long-Term Trends
This section provides detailed quantitative information on long-term investment and capacity trends in Ivorian public agricultural R&D for the period 1971 - 2008. Subsequent sections present detailed data on financial resources (Section B), human resources (Section C), and research allocation (Section D). Other supporting information provides macroeconomic trends, a list of agencies included in the study, data sources and estimation procedures, and ASTI's methodology.
Figure A1 – Public agricultural R&D spending adjusted for inflation, 1971 - 2008
Following a period of comparatively high spending on agricultural research and development (R&D) in Côte d'Ivoire, total expenditures dropped sharply in the early 1990s, recovered somewhat in the late-1990s and early 2000s, and remained relatively stable during 2002 - 08. The country invested 12.3 billion CFA francs or 42.6 million PPP dollars in agricultural R&D in 2008 (both in 2005 prices), down from 16.1 billion CFA francs or 55.9 million dollars in 2000.
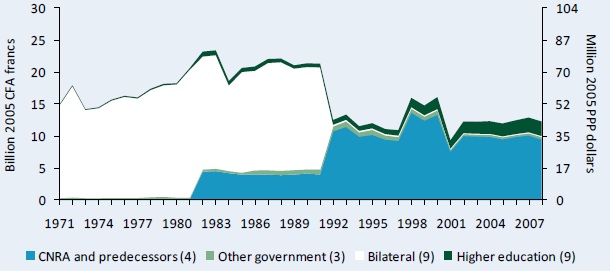
Sources: Calculated by authors from Stads and Beintema 2003 and ASTI - CNRA 2009.
Notes: Figures in parentheses indicate the number of agencies in each category. The total agency sample includes various agencies that ceased conducting research during this timeframe, including eight French bilateral government agencies that were merged with CNRA's predecessors, IDESSA and IDEFOR, in 1982 and 1992, respectively. For more information on coverage and estimation procedures, see the Côte d'Ivoire country page on ASTI's website at asti.cgiar.org/cote-divoire.
Figure A2 – Public agricultural R&D spending in current CFA francs, 1971 - 2008
Overall, public agricultural R&D spending increased during 1971 - 2008 in current prices, but levels did not keep pace with national inflation rates (see Figure A1).
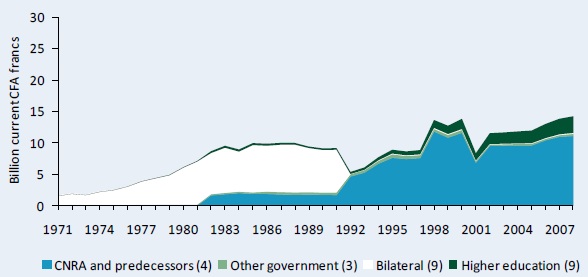
Sources: Calculated by authors from Stads and Beintema 2003 and ASTI - CNRA 2009.
Note: Figures in parentheses indicate the number of agencies in each category.
Table A1 – Public agricultural research spending, 1971 - 2008
The overall decline in public agricultural R&D spending (in real terms) was the result of reduced expenditures at the bilateral government agencies, which spent a combined average of 14.9 billion CFA francs or 51.9 million PPP dollars during 1971 - 75, compared with 0.1 billion CFA francs or 0.3 million PPP dollars during 2006 - 08 (all in constant 2005 prices). Eight of these bilateral agencies were merged with predecessors of the National Center for Agricultural Research (CNRA) during the early 1980s and early 1990s. (Note that the five-year averages presented below mask the significant fluctuations in yearly spending illustrated in Figure A1.)
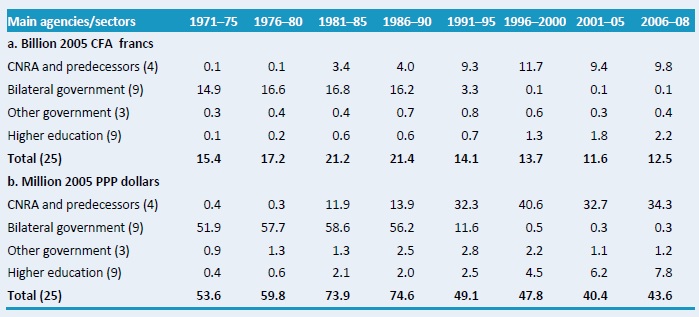
Sources: Calculated by authors from Stads and Beintema 2003 and ASTI - CNRA 2009.
Notes: Figures in parentheses indicate the number of agencies in each category. Calculations are based on five-year averages with the exception of 2006 - 08, a three-year average. Expenditures for the nine higher education agencies were estimated. See asti.cgiar.org/cote-divoire/datacoverage for more information.
Figure A3 – Shares of agricultural R&D spending by institutional category, 1971 - 2008
Throughout the 1970s and 1980s, the bilateral government agencies accounted for more than three-quarters of agricultural R&D expenditures until eight of these agencies were merged with CNRA's predecessors. During the late-1990s and 2000s, CNRA and its predecessors accounted for around 80 percent of the country's agricultural R&D spending. Throughout the period, the higher education agencies gradually increased their share, which by 2006 - 08 reached 18 percent.
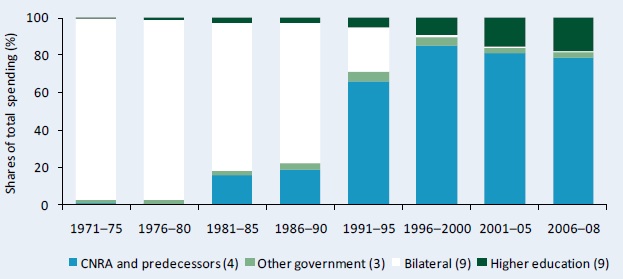
Sources: Calculated by authors from Stads and Beintema 2003 and ASTI - CNRA 2009.
Notes: Figures in parentheses indicate the number of agencies in each category. Calculations are based on five-year averages, with the exception of 2006 - 08, a three-year average.
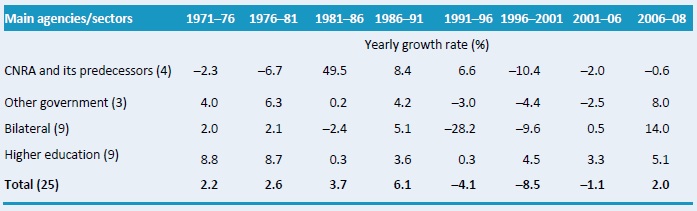
Table A2 – Yearly rates of R&D spending growth by institutional category, 1971 - 2008
Throughout the 1970s and early 1980s, growth in spending on Ivorian agricultural research stagnated or was slightly negative. Strong positive growth occurred in the early 1990s due to the aforementioned merger of bilateral government agencies with CNRA (12 percent per year), but this was more than offset by the corresponding sharp decline in spending by the bilateral agencies. During the early 1990s, overall growth declined to a low of - 9.6 percent per year, recovering somewhat in the late-1990s and early 2000s, before turning slightly negative again during 2001 - 06. The National Laboratory for Agricultural Development (LANADA) reported the highest rate of agricultural R&D spending growth during 2006 - 08 (27 percent), followed by Center for Oceanological Research (CRO) (9 percent). Main agencies/sectors
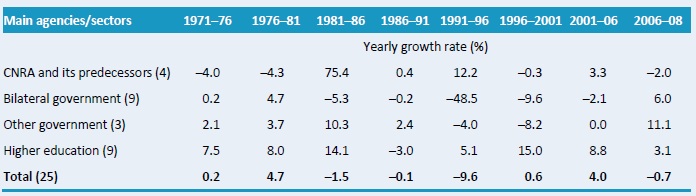
Sources: Calculated by authors from Stads and Beintema 2003 and ASTI - CNRA 2009.
Notes: Figures in parentheses indicate the number of agencies in each category. Expenditures for the nine higher education agencies were estimated. Yearly growth rates were calculated using the least - squares regression method. See asti.cgiar.org/cote-divoire/datacoverage for more information.
Figure A4 – Public agricultural research staff in full-time equivalents, 1971 - 2008
After steady increases – peaking at 245 full-time equivalent (FTE) researchers in 1989 – human resource capacity in agricultural R&D declined substantially from the early 1990s, stabilizing at around 120 FTEs between 2004 and 2008. CNRA was largely responsible for the decline.
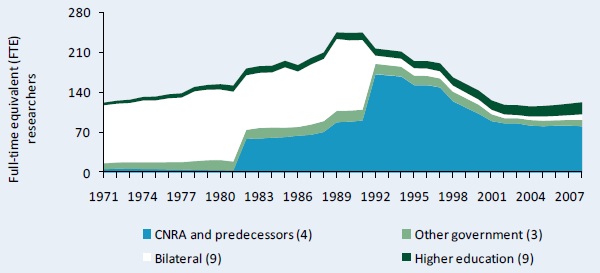
Sources: Calculated by authors from Stads and Beintema 2003 and ASTI - CNRA 2009.
Notes: Figures in parentheses indicate the number of agencies in each category. The agency sample includes various agencies that discontinued research activities before 2008, including eight French bilateral government agencies that merged with CNRA's predecessors, IDESSA and IDEFOR, in 1982 and 1992, respectively. Data include expatriate research staff employed at CNRA and CRO during the 1980s and 1990s.
Table A3 – Public agricultural research staffing in full-time equivalents, 1971 - 2008
Disaggregated data illustrate the variability of Ivorian agricultural research capacity over time. The average number of researchers in 2006 - 08 was 120 FTEs compared with 217 in 1986 - 90 and 128 during the early 1970s. Agricultural research capacity at the higher education agencies steadily rose from an average of 6 FTEs in 1971 - 75 to 20 during 2006 - 08. Main agencies/sectors
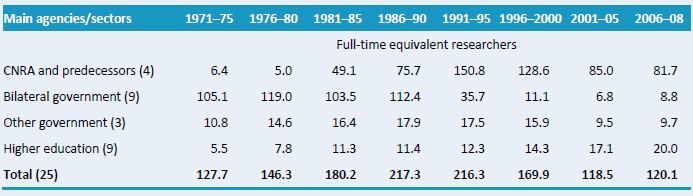
Sources: Calculated by authors from Stads and Beintema 2003 and ASTI - CNRA 2009.
Notes: Figures in parentheses indicate the number of agencies in each category. Calculations are based on five-year averages with the exception of 2006 - 08, a three-year average.
Figure A5 – Shares of public agricultural R&D staff numbers by institutional category, 1971 - 2008
Consistent with the trend in expenditures (see Figure A3), the share of FTE researchers at the bilateral government agencies dramatically decreased due to their merger with CNRA. In 2006 - 08, of all the agricultural R&D staff in Côte d'Ivoire, CNRA accounted for 68 percent, the higher education agencies for 17 percent, other government agencies for 8 percent, and the bilateral government agencies for 7 percent.
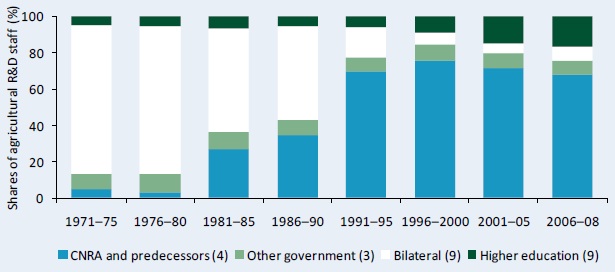
Sources: Calculated by authors from Stads and Beintema 2003 and ASTI - CNRA 2009.
Notes: Figures in parentheses indicate the number of agencies in each category. Calculations are based on five-year averages with the exception of 2006 - 08, a three-year average.
Table A4 – Annual rates of growth in R&D staff numbers by institutional category, 1971 - 2008
Overall, the average rate of growth of agricultural R&D staff was positive during the 1970s and 1980s, but negative during the 1990s and the first part of the new millennium stagnating thereafter. The total number of researchers grew by -1.1 percent per year during 2001 - 06 and 2.0 percent per year during 2006 - 08. Across agencies, the Institute of Tropical Geography at the University of Cocody-Abidjan (UCA) had the highest annual growth rate during 2006 - 08 at 31 percent. Main agencies/sectors
Sources: Calculated by authors from ASTI - CNRA 2009; Stads and Beintema 2003.
Notes: Figures in parentheses indicate the number of agencies in each category. Annual growth rates were calculated using the least-squares regression method.
Table A5 – Various agricultural research intensity ratios, 1971 - 2008
Total public spending on agricultural research as a percentage of agricultural output (AgGDP) – known as the research intensity ratio – declined from $1.15 during 1971 - 76 per $100 of agricultural output to $0.59 during 2006 - 08. All other intensity ratios also declined. Intensity ratio
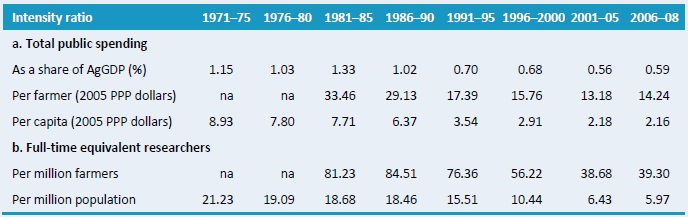
Sources: Calculated by authors from Stads and Beintema 2003, ASTI - CNRA 2009, FAO 2009, and World Bank 2009.
Notes: Calculations are based on five-year averages with the exception of 2005 - 08, a three-year average. Research spending as a share of AgGDP is calculated using a weighted average. Farmers are defined as the population economically active in agriculture, an FAO classification. Pre-1980 data on farmer numbers were not available.
Copyright (C) 2011 International Food Policy Research Institute (IFPRI) and National Center for Agricultural Research (CNRA). Sections of this Data in Focus issue may be reproduced without the express permission of, but with acknowledgment to, IFPRI and CNRA. This series has been prepared as an output for the ASTI initiative and has not been peer reviewed. Any opinions stated herein are those of ASTI and do not necessarily reflect the policies and opinions of IFPRI or CNRA.