The ASTI Data in Focus series provides additional background data in support of the 2010 Country Note on Burkina Faso (asti.cgiar.org/pdf/Burkina-Faso-Note.pdf) prepared by the Agricultural Science and Technology Indicators (ASTI) initiative and the Environment and Agricultural Research Institute (INERA). Based on data collected by ASTI and INERA, these two outputs review major investment and capacity trends in Burkina Faso’s public agricultural research and development (R&D) since 1971, providing important updates on agricultural R&D trends prepared by ASTI and INERA in 2003–04.
A. Long-Term Trends
This section provides detailed quantitative information on long-term investment and capacity trends in Burkina Faso’s public agricultural R&D for the period 1971–2008. Subsequent sections present detailed data on financial resources (Section B), human resources (Section C), and research allocation (Section D). Other supporting information provides macroeconomic trends, a list of agencies included in the study, data sources and estimation procedures, and ASTI’s methodology.
Figure A1—Public agricultural R&D spending adjusted for inflation, 1971–2008
In recent decades Burkina Faso’s agricultural research and development (R&D) expenditure levels have experienced erratic increases and decreases that coincided largely with the implementation phases of several consecutive World Bank loan funded projects. Following a peak of 6.7 billion CFA francs or 36.3 million PPP dollars in 2002, spending rapidly declined reaching 3.6 billion CFA francs or 19.5 million PPP dollars (in 2005 prices) in 2008.
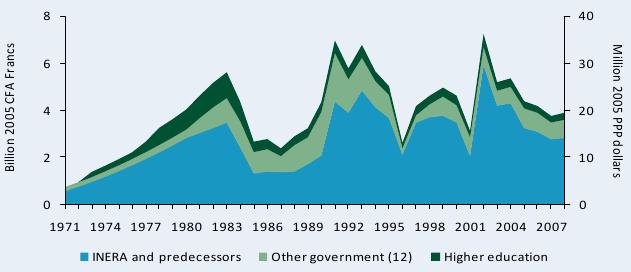
Sources: Calculated by authors from ASTI–INERA 2009–10 and Stads and Issa Boro 2004.
Notes: Figures in parentheses indicate the number of agencies in each category. Pre-1996 INERA data include CVRS, IRA, and IVRAZ, all of which are institutes that the “former” INERA inherited. Post-1996 data refer to the “new” INERA. “Other government” refers to government agencies other than INERA. Please see asti.cgiar.org/burkina-faso/agencies for a complete list of agencies. For more information on coverage and estimation procedures, see asti.cgiar.org/burkina-faso/datacoverage.
Figure A2—Public agricultural R&D spending in current CFA francs, 1971–2008
The overall trend in public agricultural R&D spending looked similar when expressed in current prices. In 2008, Burkina Faso spent 4.3 billion CFA francs compared with 3.9 billion when expressed in 2005 fixed prices.
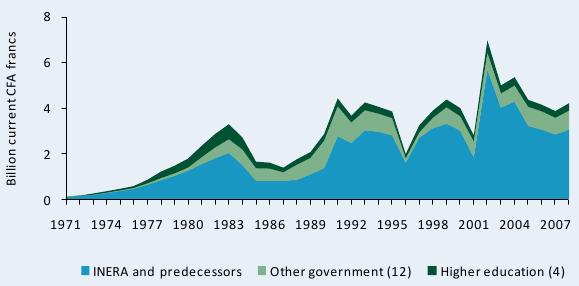
Sources: Calculated by authors from ASTI–INERA 2009–10 and Stads and Issa Boro 2004.
Notes: Figures in parentheses indicate the number of agencies in each category. See Figure A1 for sampling details.
Table A1—Public agricultural R&D spending, 1971–2008
The underlying data show that total spending on public agricultural R&D in Burkina Faso during 2006–08 averaged 4.0 billion CFA francs or 19.8 million PPP dollars per year (both in constant 2005 prices). This is higher than the levels recorded in the 1970s, but well below the levels recorded during 1991–2005 for reasons cited in Figure A1.
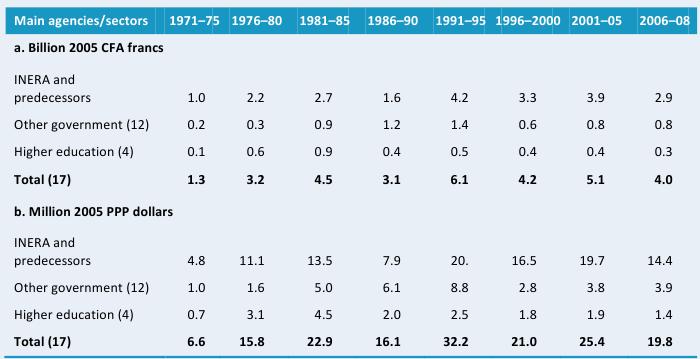
Sources: Calculated by authors from ASTI–INERA 2009–10 and Stads and Issa Boro 2004.
Notes: Calculations are based on five-year averages with the exception of 2006–08, a three-year average. Figures in parentheses indicate the number of agencies in each category. Expenditures for the 4 higher education agencies were estimated. See Figure A1 for sampling details. For more information, see asti.cgiar.org/burkina-faso/datacoverage.
Figure A3—Shares of public agricultural R&D spending by institutional category, 1971–2008
This figure shows relative levels of public agricultural R&D spending by institutional category in addition to the absolute values presented in Figures A1 and A2. The Environment and Natural Resource Research Institute (INERA) and its predecessors accounted for the largest share of expenditures over the entire period. However, the role of other government agencies fluctuated reaching a peak during the late 1980s when they accounted for 37 percent of all agricultural R&D spending in Burkina Faso. The overall share of the higher education sector was largest in the 1980s.
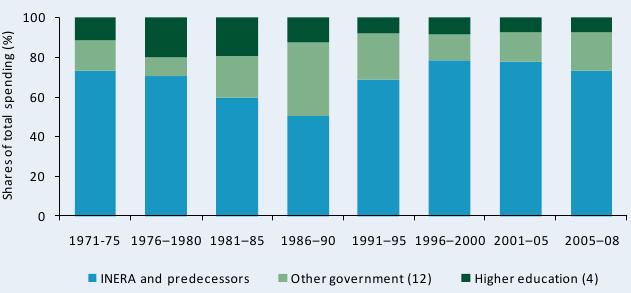
Sources: Calculated by authors from ASTI–INERA 2009–10 and Stads and Issa Boro 2004.
Notes: Figures in parentheses indicate the number of agencies in each category. Shares are based on five-year averages with the exception of 2005–08, a three-year average. See Figure A1 for sampling details.
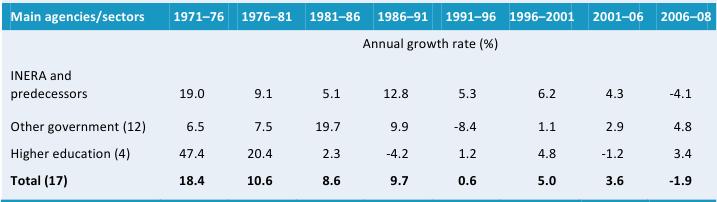
Table A2—Annual rates of R&D spending growth by institutional category, 1971–2008
The annual growth rate of public agricultural R&D spending in Burkina Faso fluctuated dramatically since the early 1970s, ranging from +25.5 percent during 1971–76 to -14.6 percent during 1991–96. The only institutional category that reported positive expenditure growth during 2006–08 was the higher education sector.
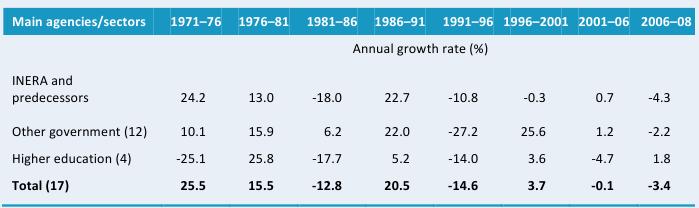
Sources: Calculated by authors from ASTI–INERA 2009–10 and Stads and Issa Boro 2004.
Notes: Annual growth rates were calculated using the least squares regression method. Figures in parentheses indicate the number of agencies in each category. Expenditures at the 4 higher education agencies were estimated. See Figure A1 for sampling details. For more information, see asti.cgiar.org/burkina-faso/datacoverage.
Figure A4—Public agricultural research staff in full-time equivalents, 1971–2008
The total number of agricultural research staff in full-time equivalents (FTE) rose gradually from just 18 in 1971 to 250 in 2004. Thereafter, researcher numbers declined somewhat reaching 240 FTEs in 2008.
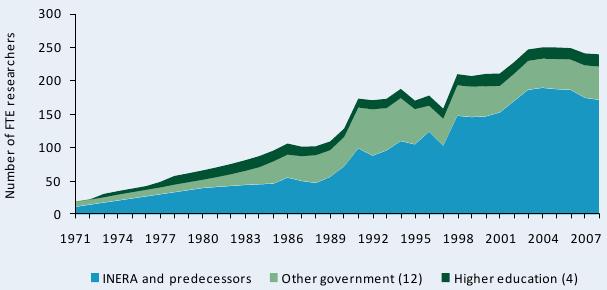
Sources: Calculated by authors from ASTI–INERA 2009–10 and Stads and Issa Boro 2004.
Notes: Figures in parentheses indicate the number of agencies in each category. See Figure A1 for sampling details. For more information on coverage and estimation procedures, see the Burkina Faso country page on ASTI’s website at asti.cgiar.org/burkina-faso/datacoverage.
Table A3—Public agricultural research staffing in full-time equivalents, 1971–2008
Agricultural research staff numbers in Burkina Faso have increased gradually since the early 1970s. Growth was particularly strong during the early 1990s. In its present form, INERA was established in 1996, when several of the research programs of the Study Institute of Agricultural Research (a former incarnation of INERA) and the forestry program of the Tropical Biology and Ecology Research Institute (IRBET) were merged. This explains the drop in the number of FTE research staff in the “Other government” category during that time. Total staff numbers in the country’s higher education sector have remained relatively stable since the early 1980s.
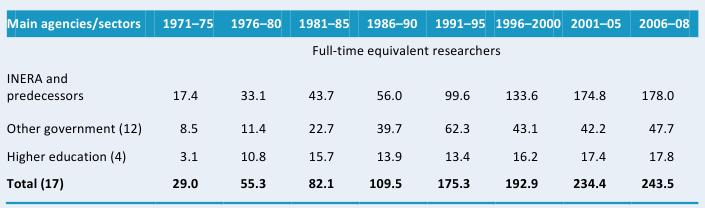
Sources: Calculated by authors from ASTI–INERA 2009–10 and Stads and Issa Boro 2004.
Notes: Calculations are based on five-year averages with the exception of 2006–08, a three-year average. Figures in parentheses indicate the number of agencies in each category. See Figure A1 for sampling details.
Figure A5—Shares of public agricultural R&D staff numbers by institutional category, 1971–2008
This figure shows the relative levels of FTE researchers across institutional categories. The large increase in the share of INERA in the late 1990s, is partially the result of the merger between IRBET and INERA. The share of the higher education sector was the highest during 1976–85.
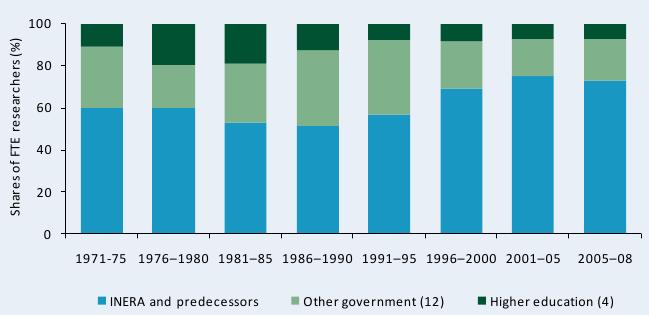
Sources: Calculated by authors from ASTI–INERA 2009–10 and Stads and Issa Boro 2004.
Notes: Figures in parentheses indicate the number of agencies in each category. See Figure A1 for sampling details.
Table A4—Annual rates of growth in R&D staffing by institutional category, 1971–2008
As seen in Figure A4 during 1971–2004, Burkina Faso experienced steady growth in its number of agricultural research staff. During 2006–08, this growth was reversed at an annual rate of -1.9 percent. INERA was responsible for this decline. The other government and the higher education agencies still reported positive growth during this period.
Sources: Calculated by authors from ASTI–INERA 2009–10 and Stads and Issa Boro 2004.
Notes: Annual growth rates were calculated using the least squares regression method. Figures in parentheses indicate the number of agencies in each category. See Figure A1 for sampling details.
Table A5—Various agricultural research intensity ratios, 1971–2008
Total public spending as a share of Agricultural GDP (AgGDP) was highly volatile during 1971–2008. Over the entire period, the amount of AgGDP and levels of public spending fluctuated significantly from one year to the next and this is reflected in the intensity ratio. FTE researchers per million population is the only intensity ratio which consistently increased throughout this period.
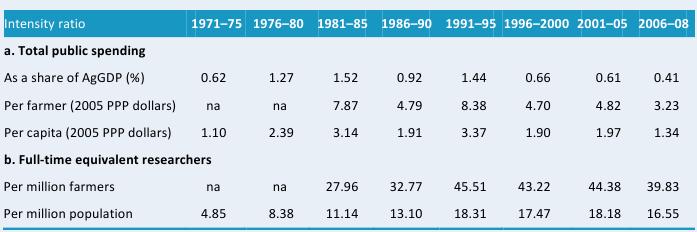
Sources: Calculated by authors from ASTI–INERA 2009–10 and Stads and Issa Boro 2004; FAO 2009; and World Bank 2009.
Notes: Calculations are based on five-year averages with the exception of 2005–08, a three-year average. Research spending as a share of AgGDP is calculated using a weighted average. Farmers are defined as the economically active agricultural population (an FAO classification). Pre-1980 data on farmer numbers were unavailable. Na stands for not available.