The ASTI Data in Focus series provides additional background data in support of the 2010 Country Note on Kenya (asti.cgiar.org/pdf/Kenya-Note.pdf) prepared by the Agricultural Science and Technology Indicators (ASTI) initiative and the Kenya Agricultural Research Institute (KARI). Based on data collected by ASTI and KARI, these two outputs review major investment and capacity trends in Kenyan public agricultural research and development (R&D) since 1971, providing important updates on agricultural R&D trends prepared by ASTI and KARI in 2000–03.
C. Human Resources
This section provides detailed quantitative information on full-time equivalent (FTE) agricultural research and support staff trends including qualifications, gender and age distribution, and support-staff-per-researcher ratios. Supplementary sections present detailed data on long-term trends (Section A), financial resources (Section B) and research allocation (Section D). Other supporting information provides macroeconomic trends, a list of agencies included in the study, data sources and estimation procedures, and ASTI’s methodology.
Table C1—Total researcher levels across various agencies, 2008
In 2008, the Kenya Agricultural Research Institute’s (KARI) 533 full-time equivalent (FTE) researchers accounted for over half of Kenya’s total agricultural R&D capacity. The higher education sector employed 235 FTE researchers or 23 percent of Kenyan agricultural R&D capacity. The University of Nairobi (UON) was the largest entity in terms of FTE researchers, employed in the Faculty of Agriculture, the Faculty of Veterinary Medicine and the School of Biological Sciences. Combined, the research foundations for coffee (CRF) and tea (TRF) employed 42 FTE researchers, accounting for 4 percent of overall capacity in 2008.

Source: Calculated by authors from ASTI–KARI 2009.
Notes: Research staff excludes expatriate staff working at KARI. For more information on coverage and estimation procedures, see the Kenya country page on ASTI’s website at asti.cgiar.org/kenya/datacoverage.
Figure C1—Research staff trends at KARI by degree (in full-time equivalents), 1971–2008
KARI’s research capacity increased from 121 FTE researchers in 1971 to 533 FTEs in 2008. In addition to this expansion in researcher numbers, KARI’s agricultural R&D staff also became more qualified over time. In 1971, only 7 percent of KARI’s researches held PhD degrees compared with 28 percent in 2008. These gains were largely the result of donor-funded training initiatives (for further details, see asti.cgiar.org/pdf/Kenya-Note.pdf).

Sources: Calculated by authors from ASTI–KARI 2009 and Beintema, Murithi, and Mwangi 2003.
Note: Research staff excludes expatriate staff working at KARI. For more information on coverage and estimation procedures, see the Kenya country page on ASTI’s website at asti.cgiar.org/kenya/datacoverage.
Figure C2—Full-time equivalent researcher trends at other government agencies by degree, 1991–2008
From 2001 to 2008, the number of researchers at the other government agencies increased from 175 to 200 FTEs. Similar to the trend at KARI, researchers at other government agencies also became better qualified during this time. The number of researchers holding PhD degrees increased from 16 to 46 FTEs, the number of researchers holding MSc degrees increased from 110 to 116 FTEs, and the number of researchers holding only a BSc degree fell from 49 to 38 FTEs.

Sources: Calculated by authors from ASTI–KARI 2009 and Beintema, Murithi, and Mwangi 2003.
Note: Research staff excludes expatriate staff working at KEFRI during 1991–2005 and at KMFRI during 1991–98.
Figure C3—Full-time equivalent researcher trends at CRF and TRF by degree, 1971–2008
Capacity at the research foundations for coffee (CRF) and tea (TRF) grew, as a combined average, between the 1970s and 2000 with minor exceptions in a couple of years. Unlike the other agency groups, however, capacity at these agencies contracted after 2001 from 57 FTE researchers to only 42 by 2008, representing a loss of 18 percent.

Sources: Calculated by authors from ASTI–KARI 2009 and Beintema, Murithi, and Mwangi 2003.
Note: Research staff excludes expatriate staff working at CRF and TRF during the 1970s and 1980s.
Figure C4—Full-time equivalent researcher trends at higher education agencies by degree, 2001–08
During 2001–08, the number of researchers employed at the higher education agencies increased from 191 to 235 FTEs following an erratic yearly trend. The largest increase occurred between 2007 and 2008, when researcher numbers grew from 195.6 to 234.9 FTEs (a 20 percent increase).

Sources: Calculated by authors from ASTI–KARI 2009, Mutunga and de Nooijer 2006, and Kenyatta University 2009.
Note: Research staff excludes expatriate staff working at the higher education agencies.
Figure C5—Distribution of researcher qualifications across various agencies, 2008
On average, more than 25 percent of research staff employed in the higher education sector were qualified to the PhD level in 2008. Seven agencies reported shares of PhD-qualified researchers of at least 50 percent, with Jomo Kenyatta University of Agriculture and Technology (JKUAT) having the highest share (76 percent). Consistent with finding worldwide, the higher education agencies employed more PhD-qualified researchers on average compared with the government and nonprofit agencies.

Source: Calculated by authors from ASTI–KARI 2009.
Figure C6—Female share of researchers by degree and institutional category, 2000 and 2008
Although the share of female agricultural researchers increased from 20 percent in 2000 to 27 percent in 2008, women remain underrepresented in Kenya. In 2008, of the 804 FTE researchers for which gender data were available, only 216 were female. On a positive note, the share of women increased across all qualification levels during this period, but especially in the categories of MSc- and PhD-qualified researchers.

Sources: Calculated by authors from ASTI–KARI 2009 and Beintema, Murithi, and Mwangi 2003.
Note: Figures in parentheses indicate the number of agencies in each category. 2000 gender data were only available for KARI, KMFRI, KIRDI , FA-UM, FA-UON, FVM-UON, and NRM-Moi. For a complete list of agency names, see asti.cgiar.org/kenya/datacoverage.
Figure C7— Distribution of researcher qualifications by gender, 2000 and 2008
The share of PhD-qualified male researchers increased from 27 to 32 percent during 2000–2008, whereas the share of PhD-qualified female researchers increased from 22 to 30 percent over this timeframe.

Sources: Calculated by authors from ASTI–KARI 2009 and Beintema, Murithi, and Mwangi 2003.
Note: See Figure C6 for agency sample size.
Figure C8—Female share in total FTE research staff by degree across various agencies, 2008
In 2008, the Kenya Industrial Research and Development Institute (KIRDI) employed the highest share of female researchers, at 39 percent, but none of these researchers held PhD degrees. At KARI, 30 percent of the researchers were female, and among them, 9 percent held PhD degrees, 16 percent held MSc degrees, and 4 percent held BSc degrees. In contrast, only 9 percent of researchers at the other universities (as a combined average) were female, but almost all of them were PhD qualified.
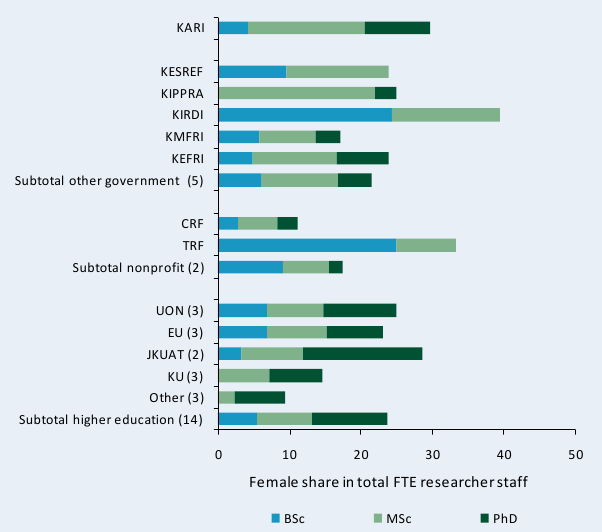
Source: Calculated by authors from ASTI–KARI 2009.
Figure C9—Age distribution of KARI researchers by gender, 2007
At KARI, 76 percent of researchers were over 40 years old in 2007, and 37 percent were between the ages 51 and 60. Male researchers were older than their female colleagues: in 2007, 42 percent of the male researchers compared with only 25 percent of the female researchers were between the ages of 51 and 60 years.
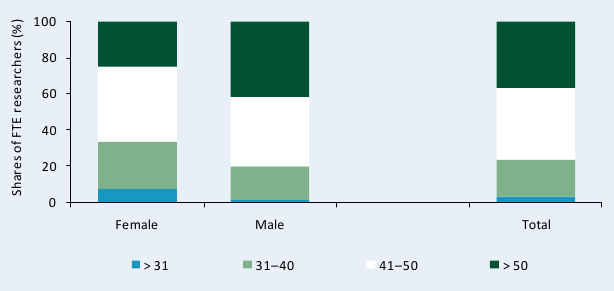
Source: Calculated by authors from ASTI–AWARD 2008/09.
Figure C10—Trends in full-time equivalent researchers and technicians at KARI, 2001–08
Figure C10—Trends in full-time equivalent researchers and technicians at KARI, 2001–08 The number of FTE researchers and technicians with university degrees rose after 2001. Only 5 technicians held BSc degrees that year, whereas by 2008 16 FTE technicians were BSc qualified.
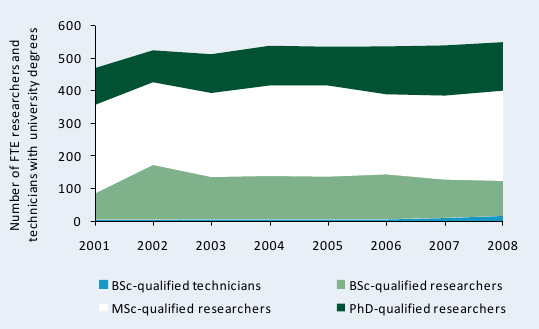
Sources: Calculated by authors from ASTI–KARI 2009 and Beintema, Murithi, and Mwangi 2003.
Figure C11—Support-staff-per-researcher ratios by institutional category, 2001 and 2008
As a result of increasing numbers of FTE researchers and declining numbers of support staff, overall support-staff-per-researcher ratios were much lower in 2008 than in 2001 (4.9 compared with 6.8). The government and nonprofit sectors reported much higher ratios compared with the higher education sector, but this is common given that research is a secondary mandate at the higher education agencies.
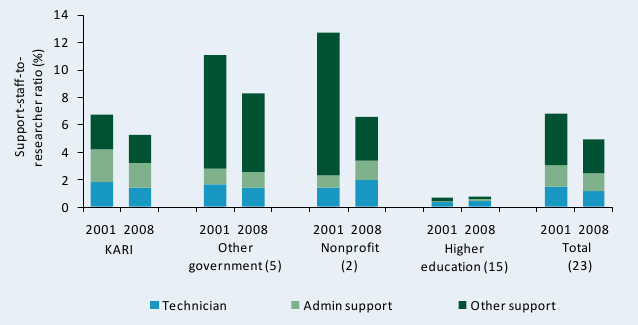
Source: Calculated by authors from ASTI–KARI 2009.
Notes: Figures in parentheses indicate the number of agencies in each category. For more information on coverage and estimation procedures, see the Kenya country page on ASTI’s website at asti.cgiar.org/kenya/datacoverage.