The ASTI Data in Focus series provides additional background data in support of the 2010 Country Note on Kenya (asti.cgiar.org/pdf/Kenya-Note.pdf) prepared by the Agricultural Science and Technology Indicators (ASTI) initiative and the Kenya Agricultural Research Institute (KARI). Based on data collected by ASTI and KARI, these two outputs review major investment and capacity trends in Kenyan public agricultural research and development (R&D) since 1971, providing important updates on agricultural R&D trends prepared by ASTI and KARI in 2000–03.
B. Financial resources
This section provides detailed quantitative information on agricultural research expenditures and sources of funding in the government sector in Kenya for the period 1991–2008. Supplementary sections present detailed data on long-term trends (Section A), human resources (Section C), and research allocation (Section D). Other supporting information provides macroeconomic trends, a list of agencies included in the study, data sources and estimation procedures, and ASTI’s methodology.
Table B1—Total spending levels in million 2005 Kenyan shillings at various agencies, 2008
In 2008 the Kenyan Agricultural Research Institute (KARI) accounted for the largest share of expenditures of any single agency, at 2.2 billion 2005 Kenyan shillings, and the Kenyan Forestry Research Institute (KEFRI) ranked second, reporting expenditures of 0.5 billion 2005 Kenyan shillings.
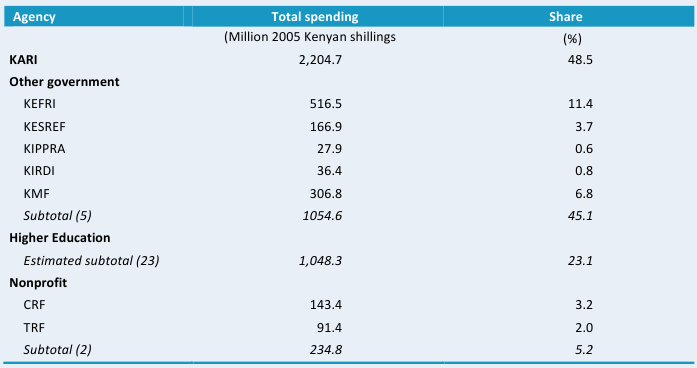
Source: Calculated by authors from IFPRI–KARI 2009.
Notes: Figures in parentheses indicate the number of agencies in each category. Expenditures for the 23 higher education agencies were estimated. For more information on coverage and estimation procedures, see the Kenya country page on ASTI’s website at asti.cgiar.org/kenya/datacoverage. For full agency names see asti.cgiar.org/kenya/agencies.
Figure B1—KARI’s spending by cost-category adjusted for inflation, 1991–2008
From 1991 to 2008, on average KARI spent slightly more than half of its budget on operating costs, 43 percent on salaries, and 6 percent on capital expenses. KARI’s capital investments peaked at 16 percent in 2006 when a World Bank loan financed investments in infrastructure and equipment at various research facilities (for more information, see the Kenya Country Note on ASTI’s website at asti.cgiar.org/pdf/Kenya-Note.pdf).
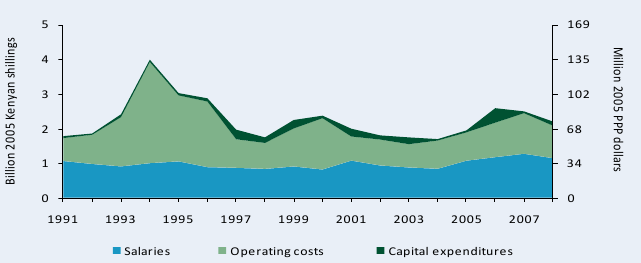
Sources: Calculated by authors from ASTI–KARI 2009 and Beintema, Murithi, and Mwangi 2003.
Notes: Salaries exclude those of expatriate staff. For more information on coverage and estimation procedures, see the Kenya country page on ASTI’s website at asti.cgiar.org/kenya/datacoverage.
Figure B2—Distribution of spending by cost category across government agencies, 2008
In 2008, the Kenya Sugar Research Foundation (KESREF) spent the largest portion of its budget on capital expenditures, at 53 percent, although this was an exception to the average of 31 percent over prior years. In contrast, the Kenya Institute for Public Policy Research & Analysis (KIPPRA) made no capital investments in 2008, and the remaining four agencies spent more than half their budgets on salaries, ranging from 52 percent at KARI to 72 percent at Kenya Industrial Research and Development Institute (KIRDI).
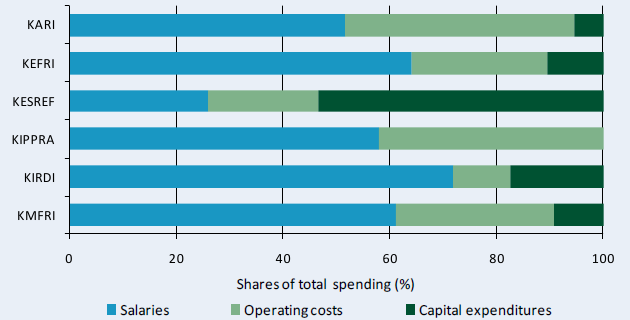
Sources: Calculated by authors from ASTI–KARI 2009.
Figure B3—KARI’s funding sources adjusted for inflation, 1991–2008
During 1991–2008, KARI relied on the government, donors, and development bank loans, as well as the sale of goods and services to fund its agricultural R&D activities. During this period, KARI’s funding fluctuated considerably due to the completion of donor-funded projects and variations in internally generated sales. Overall, funding increased from 1.7 billion Kenyan shillings or 58.0 million PPP dollars in 1991 to 2.5 billion Kenyan shillings or 85.4 million 2005 PPP dollars in 2008 (all in 2005 constant prices).
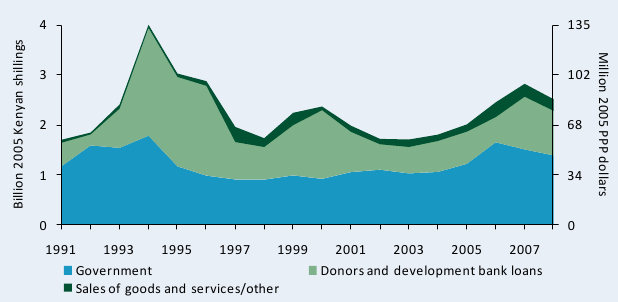
Sources: Calculated by authors from ASTI–KARI 2009 and Beintema, Murithi, and Mwangi 2003.
Note: Donor funding does not include the salaries of expatriate staff working at KARI.
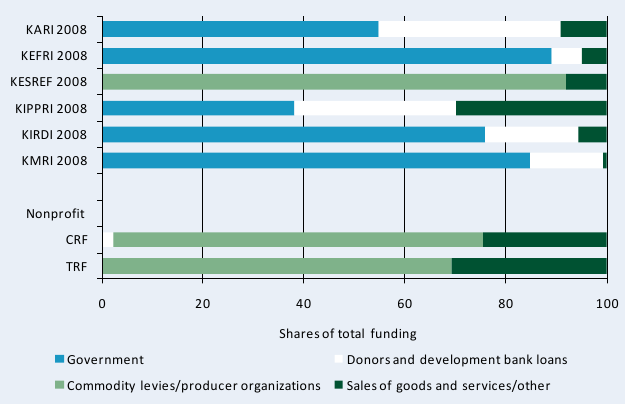
Figure B4—Distribution of funding sources in the government and nonprofit sectors, 2008
In 2008, the national government was the major source funding for most of the six government agencies involved in agricultural R&D, with KESREF—which derives most of its funding from the sugar industry—being the exception. The research foundations for coffee (CRF) and tea (TRF) also received most of their funding from commodity levies, supplemented by the sale of goods and services, which in 2008 accounted for 23 and 31 percent, respectively.
Source: Calculated by authors from ASTI–KARI 2009.