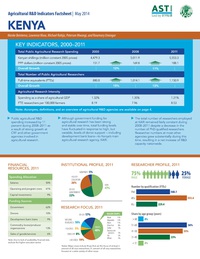
The ASTI Data in Focus series provides additional background data in support of the 2010 Country Note on Kenya (asti.cgiar.org/pdf/Kenya-Note.pdf) prepared by the Agricultural Science and Technology Indicators (ASTI) initiative and the Kenya Agricultural Research Institute (KARI). Based on data collected by ASTI and KARI, these two outputs review major investment and capacity trends in Kenyan public agricultural research and development (R&D) since 1971, providing important updates on agricultural R&D trends prepared by ASTI and KARI in 2000–03.
A. Long-Term Trends
This section provides detailed quantitative information on long-term investment and capacity trends in Kenyan public agricultural R&D for the period 1971–2008. Subsequent sections present detailed data on financial resources (Section B), human resources (Section C), and research allocation (Section D). Other supporting information provides macroeconomic trends, a list of agencies included in the study, data sources and estimation procedures, and ASTI’s methodology.
Figure A1—Public agricultural R&D spending adjusted for inflation, 1971–2008
Public spending on agricultural research and development (R&D) in Kenya varied considerably over the period 1971–2008. During the 1970s, expenditures fluctuated slightly, ranging between 2.0 and 2.7 billion Kenyan shillings or 69.4 and 92.0 million PPP dollars (in 2005 prices). During the 1980s, agricultural R&D spending increased drastically as a result of the establishment of several government and higher education agencies. Variations occurring throughout the 1990s and after the turn of the millennium stemmed from fluctuations in donor funding to the Kenya Agricultural Research Institute (KARI).
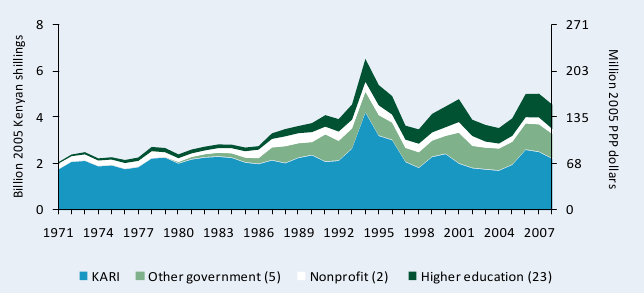
Sources: Calculated by authors from ASTI–KARI 2009 and Beintema, Murithi, and Mwangi 2003.
Notes: Figures in parentheses indicate the number of agencies in each category. 1971–86 data for KARI include the institute’s predecessors. For more information on coverage and estimation procedures, see the Kenya country page on ASTI’s website at asti.cgiar.org/kenya/datacoverage.
Figure A2—Public agricultural R&D spending in current Kenyan shillings, 1981–2008
Public agricultural R&D spending increased more rapidly in current prices, although fluctuations after the 1990s were less pronounced than inflation-adjusted prices.
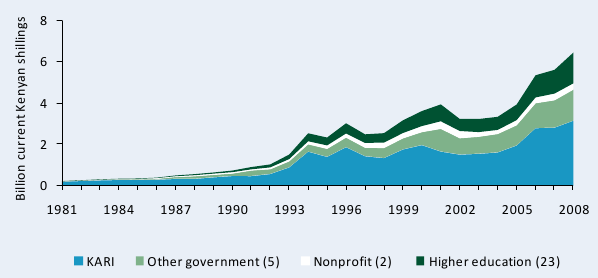
Sources: Calculated by authors from ASTI–KARI 2009 and Beintema, Murithi, and Mwangi 2003.
Notes: Figures in parentheses indicate the number of agencies in each category. 1971–86 data for KARI include the
institute’s predecessors.
Table A1—Public agricultural research spending, 1971–2008
Total spending on public agricultural R&D in Kenya during 2006–08 averaged 4.9 billion Kenyan shillings or 164.4 million PPP dollars per year, which is well above the levels recorded in the 1970s and 1980s. By way of comparison, Kenya spent less than half this amount during 1971–75, reaching an average of 2.3 billion Kenyan shillings or 77.3 million PPP dollars per year (all in constant 2005 prices). Note that the five-year averages presented below do not reflect the large, yearly fluctuations in spending illustrated in Figure A1.
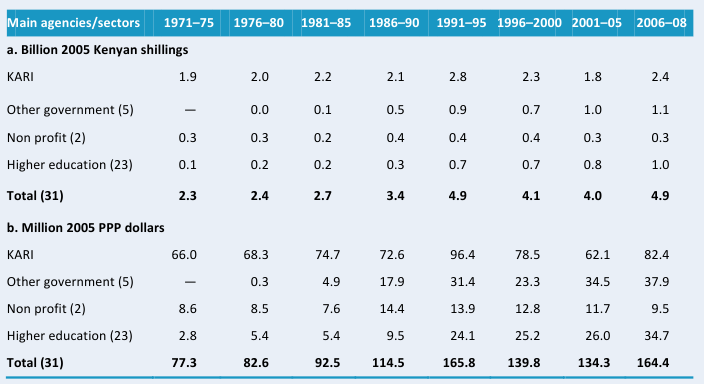
Sources: Calculated by authors from ASTI–KARI 2009 and Beintema, Murithi, and Mwangi 2003.
Notes: Figures in parentheses indicate the number of agencies in each category. Calculations are based on five-year
averages, with the exception of 2005–08—a three-year average. 1971–86 data for KARI include the
institute’s predecessors.
Figure A3—Shares of agricultural R&D spending by institutional category, 1971–2008
During 2006–08, KARI accounted for 50 percent of Kenya’s total agricultural R&D spending, compared with 85 percent in the early 1970s. This decline resulted from increased spending levels of other government agencies and in the higher education sector, whose share of agricultural R&D expenditures grew from 4 percent during 1971–75 to 21 percent during 2006– 08.
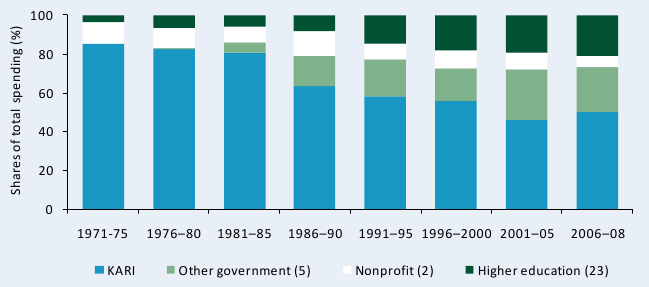
Sources: Calculated by authors from ASTI–KARI 2009 and Beintema, Murithi, and Mwangi 2003.
Notes: Figures in parentheses indicate the number of agencies in each category. Calculations are based on five- year averages, with the exception of 2006–08—a three-year average. 1971–86 data for KARI include the institute’s predecessors.
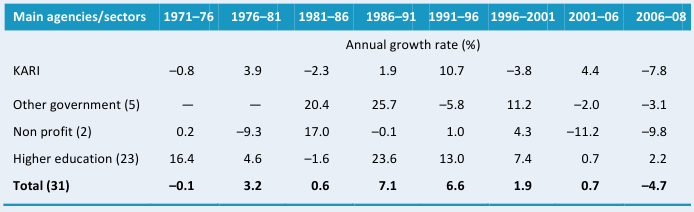
Table A2—Annual rates of R&D spending growth by institutional category, 1971–2008
Annual rates of agricultural R&D spending growth in Kenya fluctuated by year and across agencies, in line with absolute expenditure trends (see Figure A1). After a period of stagnating growth during 1971–76, yearly growth remained positive until 2006–08, when agricultural R&D expenditures fell by –4.7 percent per year. During this period, large variations were reported across the government agencies. The Kenya Sugar Research Foundation (KESREF) benefited from yearly growth of 18.9 percent during 2006–08, whereas the Kenya Industrial Research and Development Institute (KIRDI) grew at only 4.0 percent per year during this timeframe. The remaining three government agencies experienced negative growth of more than –4.8 percent.
Sources: Calculated by authors from ASTI–KARI 2009 and Beintema, Murithi, and Mwangi 2003.
Notes: Figures in parentheses indicate the number of agencies in each category. Expenditures for the 23 higher
education agencies were estimated. Annual growth rates were calculated using the least-squares regression method. See asti.cgiar.org/kenya/datacoverage for more information.
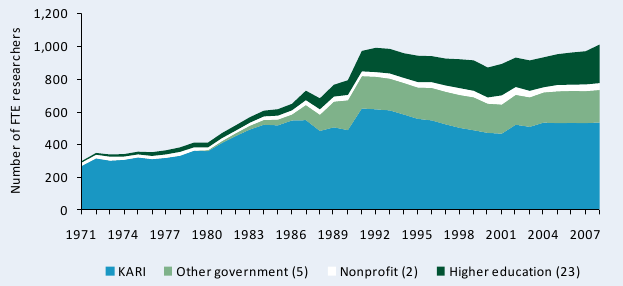
Figure A4—Public agricultural research staff in full-time equivalents, 1971–2008
The total number of agricultural researchers employed in Kenya increased from 299 full-time equivalent (FTE) researchers in 1971 to 1,011 FTEs in 2008. It should be noted, however, that the 2008 total represents only a slight increase over levels recorded in the early 1990s.
Sources: Calculated by authors from ASTI–KARI 2009; Beintema, Murithi, and Mwangi 2003; Mutunga and de Nooijer 2006; and Kenyatta University 2009.
Note: Figures in parentheses indicate the number of agencies in each category.
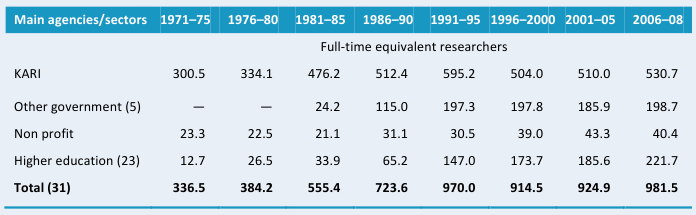
Table A3—Public agricultural research staffing in full-time equivalents, 1971–2008
Disaggregated data illustrate that Kenya’s research capacity has been strengthened over time. Total researcher numbers increased from an average 337 FTEs in the early 1970s to 982 FTEs during 2006–08.
Sources: Calculated by authors from ASTI–KARI 2009; Beintema, Murithi, and Mwangi 2003; Mutunga and de Nooijer 2006; and Kenyatta University 2009.
Notes: Figures in parentheses indicate the number of agencies in each category. Calculations are based on five-year averages, with the exception of 2006–08—a three-year average.
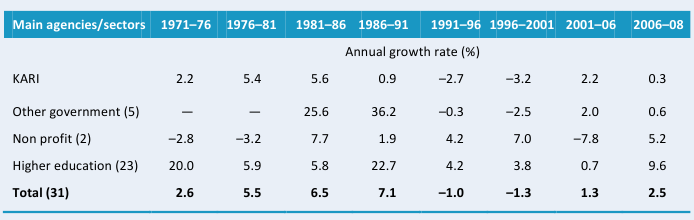
Table A4—Annual rates of growth in R&D staff numbers by institutional category, 1971–2008
Overall, the average rate of growth of agricultural R&D staff was positive during the 1970s and 1980s, but negative during the 1990s. The total number of researchers grew by 1.3 percent per year during 2001–06 and 2.5 percent per year during 2006–08. All agencies went through periods of positive and negative growth during the 1971–2008 period, with the exception of the higher education agencies, which maintained positive growth rates throughout the period.
Sources: Calculated by authors from ASTI-KARI 2009 and Beintema, Murithi, and Mwangi 2003.
Notes: Figures in parentheses indicate the number of agencies in each category. Annual growth rates were
calculated using the least-squares regression method.
Figure A5—Shares of public agricultural R&D staff numbers by institutional category, 1971–2008
Due the increased role of other government and higher education agencies in Kenyan agricultural R&D over time, KARI’s share of total research staffing (in FTEs) declined from 89 percent during 1971–75 to 54 percent during 2006–08, during which time the higher education agencies accounted for 22 percent of researchers, other government agencies accounted for 20 percent, and the nonprofit sector accounted for 4 percent.
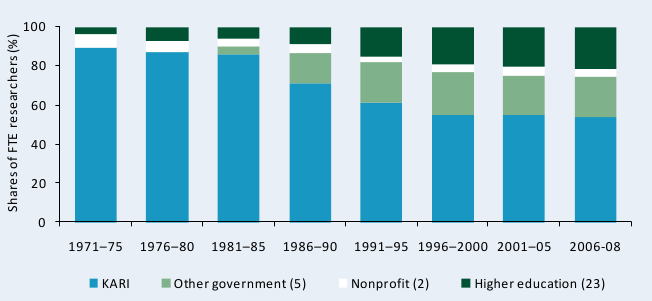
Sources: Calculated by authors from ASTI–KARI 2009 and Beintema, Murithi, and Mwangi 2003.
Notes: Figures in parentheses indicate the number of agencies in each category. Calculations are based on five-year averages, with the exception of 2006–08—a three-year average.
Table A5—Various agricultural research intensity ratios, 1971–2008
Total public spending on agricultural research as a percentage of agricultural output (AgGDP)—known as the research intensity ratio—fluctuated from year to year following spending trends and peaked in the early 1990s at $1.85 for every $100 of agricultural output. By 2006–08, this ratio had fallen to $1.39 per $100 of agricultural output. The average number of FTE researchers per million farmers also peaked in the 1990s, at 110.9, and then fell to an average of 77.8 FTEs during 2006–08.
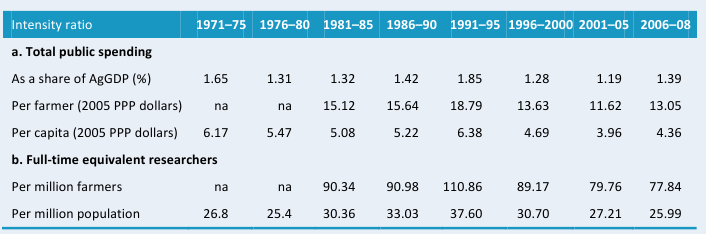
Sources: Calculated by authors from ASTI-KARI 2009; Beintema, Murithi, and Mwangi 2003; FAO 2009; and World
Bank 2009.
Notes: Calculations are based on five-year averages, with the exception of 2005–08—a three-year average. Research spending as a share of AgGDP is calculated using a weighted average. Farmers are defined as population economically active in agriculture, an FAO classification. Pre-1980 data on farmer number were not available.