A. Long-Term Trends
This section provides detailed quantitative information on long-term investment and capacity trends in Ghanaian public agricultural R&D for the period 1971–2008. Subsequent sections present detailed data on financial resources (Section B), human resources (Section C), and research allocation (Section D). Other supporting information provides macroeconomic trends, a list of agencies included in the study, data sources and estimation procedures, and ASTI’s methodology.
Figure A1—Agricultural R&D spending adjusted for inflation, 1971–2008
Since 1971, agricultural R&D spending has increased dramatically. In 1971, Ghana spent 65.7 billion Ghanaian cedis or 17.7 million PPP dollars on public agricultural R&D compared with 351.8 billion cedis or 94.6 million US PPP dollars in 2008 (in 2005 prices). After a long period of stagnation, spending more than doubled during 2000–08. This large increase reflects a policy environment in which the Ghanaian government recognizes the role of agricultural R&D in supporting the country’s national development agenda.
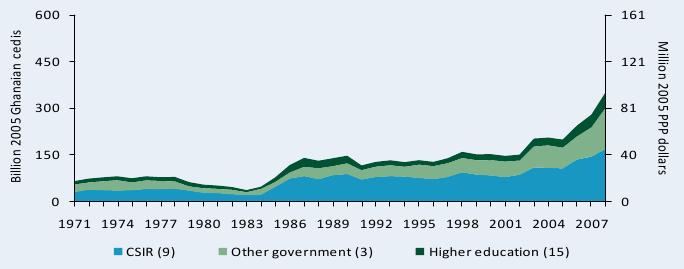
Sources: Calculated by authors from ASTI–STEPRI 2009 and Stads and Gogo 2004.
Notes: Figures in parentheses indicate the number of agencies in each category. Financial data are presented in “old” Ghanaian cedis. The “new” cedi was introduced on July 3, 2007, and equals 10,000 ”old” cedis. For more information on coverage and estimation procedures, see asti.cgiar.org/ghana/datacoverage.
Figure A2—Agricultural R&D spending in current Ghanaian cedis, 1991–2008
In current prices, public agricultural R&D spending increased even more dramatically. In 2008, Ghana spent 532.8 billion current cedis compared with 351.8 billion adjusted for inflation (in 2005 prices).
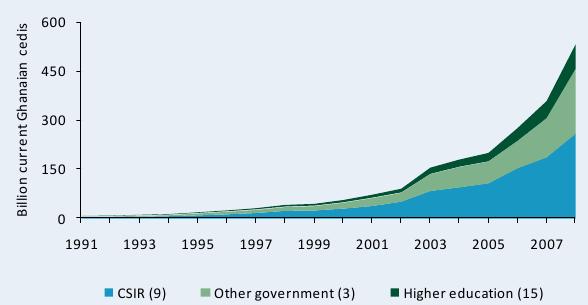
Sources: Calculated by authors from ASTI–STEPRI 2009 and Stads and Gogo 2004.
Note: Figures in parentheses indicate the number of agencies in each category.
Table A1—Agricultural research spending, 1971–2008
The underlying data show that total spending on public agricultural R&D in Ghana during 2006–08 averaged 291.8 billion cedis or 78.4 million PPP dollars per year (both in constant 2005
prices), which is well above the levels recorded in the 1980s and 1990s. By way of comparison, Ghana spent an average of 74.7 billion cedis or 20.1 million PPP dollars per year on public agricultural R&D in the early 1970s.
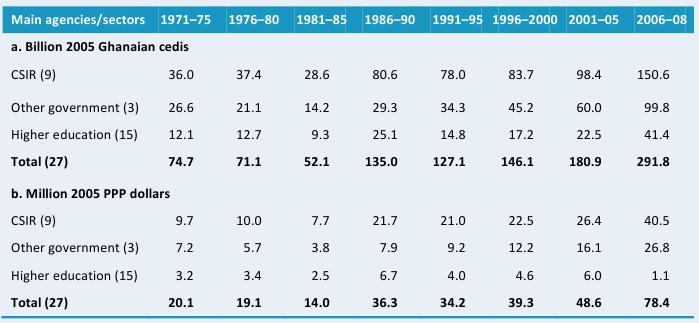
Sources: Calculated by authors from ASTI–STEPRI 2009 and Stads and Gogo 2004.
Notes: Calculations are based on five-year averages with the exception of 2006–08, a three-year average. Figures in parentheses indicate the number of agencies in each category. Expenditures for the 15 higher education agencies were estimated. For more information, see asti.cgiar.org/ghana/datacoverage.
Figure A3—Shares of agricultural R&D spending by institutional category, 1971–2008
This figure shows relative levels of public agricultural R&D spending by institutional category in addition to the absolute values presented in Figures A1 and A2. The nine agriculture-related institutes under the Council for Scientific and Industrial Research (CSIR) accounted for the largest share of expenditures; however, other government and higher education agencies have begun to play an increasingly important role since the early 1990s. During 2005–08, CSIR accounted for an average of 52 percent of public agricultural R&D expenditures, other government agencies for 34 percent, and higher education agencies for the remaining 14 percent.
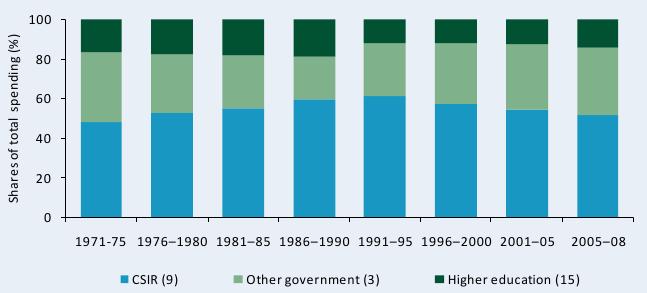
Sources: Calculated by authors from ASTI–STEPRI 2009 and Stads and Gogo 2004.
Notes: Figures in parentheses indicate the number of agencies in each category. Shares are based on five-year averages with the exception of 2005–08, a three-year average.
Table A2—Annual rates of R&D spending growth by institutional category, 1971–2008
The annual rate of growth in public agricultural R&D spending in Ghana was positive in the four decades to 2008, with the exception of the late-1970s, during which time spending declined. The longest period of sustained growth—that is, more than 10 percent per year—occurred from 2001 until 2008, and total spending actually grew by 20 percent per year during 2006–08. There was significant variation across CSIR agencies, however. For example, expenditures at the Forestry Research Institute of Ghana (FORIG) and Plant Genetic Resources Research Institute (PGGRI) grew 25 percent per year during 2006–08, whereas those at the Animal Research Institute (ARI) grew by only 8 percent per year.
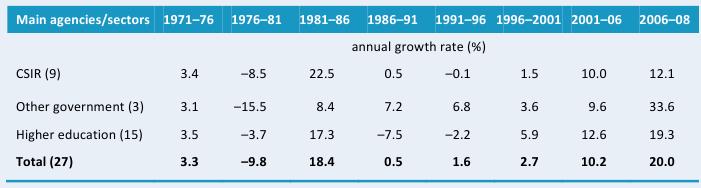
Sources: Calculated by authors from ASTI–STEPRI 2009 and Stads and Gogo 2004.
Notes: Annual growth rates were calculated using the least squares regression method. Figures in parentheses indicate the number of agencies in each category. Expenditures at the 15 higher education agencies were estimated. For more information, see asti.cgiar.org/ghana/datacoverage.
Figure A4—Public agricultural research staff in full-time equivalents, 1971–2008
The total number of agricultural research staff in full-time equivalents (FTE) rose substantially after 1971, with growth mostly occurring within the nine agencies under CSIR (87 FTE researchers in 1971 compared with 358 in 2008).
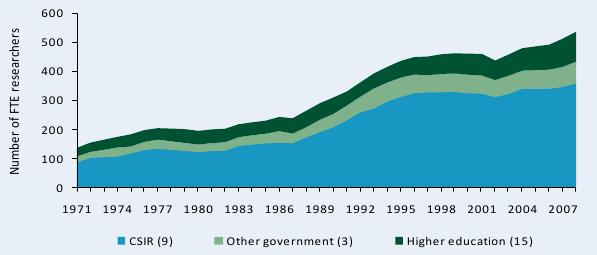
Sources: Calculated by authors from ASTI–STEPRI 2009, Stads and Gogo 2004, BNARI 2007, KNUST 2010, and University of Ghana (various years).
Notes: Figures in parentheses indicate the number of agencies in each category. For more information on coverage and estimation procedures, see the Ghana country page on ASTI’s website at asti.cgiar.org/ghana/datacoverage.
Table A3—Public agricultural research staffing in full-time equivalents, 1971–2008
Disaggregated data illustrate the strengthening of human resource capacity in Ghana’s agricultural R&D system over time. The average number of FTE researchers increased from 162 in the early 1970s to 514 during 2005–08.
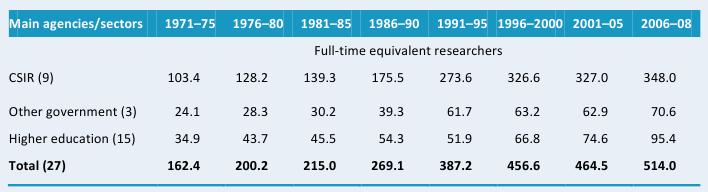
Sources: Calculated by authors from ASTI-STEPRI 2009; Stads and Gogo 2004; BNARI 2007; KNUST 2010; and University of Ghana, various years.
Notes: Calculations are based on five-year averages with the exception of 2006–08, a three-year average. Figures in parentheses indicate the number of agencies in each category.
Table A4—Annual rates of growth in R&D staffing by institutional category, 1971–2008
As with its total agricultural R&D spending, Ghana experienced negative growth in public agricultural R&D capacity during the late-1970s. Since that time, total annual growth rates (measured in five-year intervals) remained positive, but variable. Growth was particularly strong during the early 1990s (6.3 percent) and after the turn of the millennium (4.5 percent). Despite its large rate of growth in expenditures per year, FORIG’s capacity growth only averaged 1 percent per year. In contrast, PGRRI and ARI experienced growth of 26 and 24 percent per year, respectively.
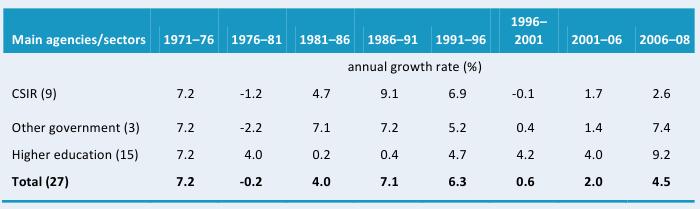
Sources: Calculated by authors from ASTI–STEPRI 2009, Stads and Gogo 2004, BNARI 2007, KNUST 2010, and University of Ghana (various years).
Notes: Annual growth rates were calculated using the least squares regression method. Figures in parentheses indicate the number of agencies in each category.
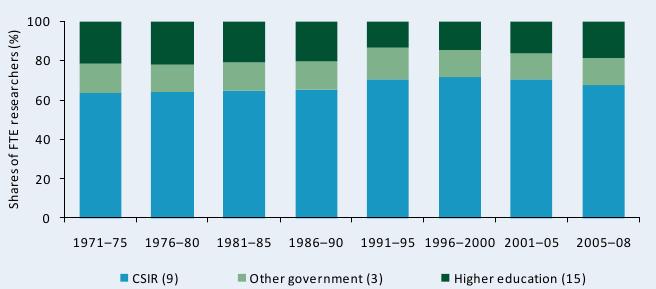
Figure A5—Shares of public agricultural R&D staff numbers by institutional category, 1971– 2008
This figure shows the relative levels of FTE researchers across institutional categories. The distribution only changed slightly over the 1971–2008 timeframe. During 2005–08, CSIR accounted for 68 percent of FTE researchers on average, slightly higher than the 64 percent average recorded during 1971–75. Due to large increases in FTE researcher numbers at CSIR, the higher education agency share declined in the early 1990s but regained ground after 2005 (from 2005 until 2008, the sector accounted for an average of 19 percent of the country’s total number of agricultural researchers in FTEs).
Sources: Calculated by authors from ASTI-STEPRI 2009; Stads and Gogo 2004; BNARI 2007; KNUST 2010; and University of Ghana, various years.
Note: Figures in parentheses indicate the number of agencies in each category.
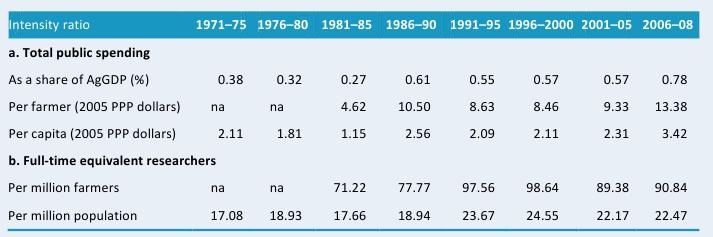
Table A5—Various agricultural research intensity ratios, 1971–2008
Unsurprisingly, all agricultural research intensity ratios increased during the 1971–2008 period; in particular, research spending as a share of agricultural gross domestic product (AgGDP) doubled from $0.38 per year during the early 1970s to $0.78 per year during 2005–08.
Sources: Calculated by authors from ASTI–STEPRI 2009; Stads and Gogo 2004; FAO 2009; and World Bank 2009.
Notes: Calculations are based on five-year averages with the exception of 2005–08, a three-year average. Research spending as a share of AgGDP is calculated using a weighted average. Farmers are defined as the economically active agricultural population (an FAO classification). Pre-1980 data on farmer number were unavailable.